


 23 September 2014
2014- n° 222In Q2 2014, French GDP held steady and households’ purchasing power increased (+0.5%) Quarterly national accounts - detailed figures - 2nd quarter 2014
23 September 2014
2014- n° 222In Q2 2014, French GDP held steady and households’ purchasing power increased (+0.5%) Quarterly national accounts - detailed figures - 2nd quarter 2014
In Q2 2014, as in Q1, French gross domestic product (GDP) in volume terms* remained steady. The previous release (august 14th, 2014) is thus overall confirmed.
In Q2 2014, as in Q1, French gross domestic product (GDP) in volume terms* remained steady. The previous release (august 14th, 2014) is thus overall confirmed.
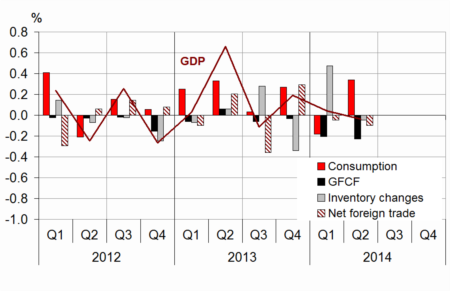
Households’ consumption expenditure upturned (+0.4% after –0.6%), while total gross fixed capital formation (GFCF) remained depressed (–1.1% after –0.9%). All in all, final domestic demand (excluding changes in inventories) slightly increased and contributed for +0.1 points to GDP evolution (after –0.4 points in Q1).
Imports decelerated (+0.4% after +0.8%), but slightly less than exports (+0.1% after +0.6%). Consequently, the foreign trade balance contributed negatively to activity (–0.1 points). Finally, changes in inventories had a neutral contribution to GDP growth (0.0 points, after +0.5 points in Q1).
Household’s purchasing power rose by 0.5%
Household’s gross disposable income (GDI) decelerated strongly in Q2 2014 (+0.5% after +1.3%). Wages earned by households slightly slowed (+0.4% after +0.5%), notably because of the deceleration of the average wage per capita paid by non-financial corporations (+0.3% after +0.5%). Social benefits also decelerated (+0.3% after +0.6%). Taxes on income and wealth, which had markedly dropped in Q1 (–4.3%) after a strong H2 2013, remained fairly stable in Q2 (–0.5%).
graphiqueGraph1 – GDP and its main components
tableauTab1 – Goods and services:supply and uses chain-linked volumes
| 2013 Q3 | 2013 Q4 | 2014 Q1 | 2014 Q2 | 2013 | 2014 (ovhg) | |
|---|---|---|---|---|---|---|
| GDP | -0.1 | 0.2 | 0.0 | 0.0 | 0.4 | 0.3 |
| Imports | 0.6 | 0.4 | 0.8 | 0.4 | 1.9 | 2.2 |
| Household' consumption *expenditure | -0.1 | 0.2 | -0.6 | 0.4 | 0.3 | 0.0 |
| General government's *consumption expenditure | 0.3 | 0.6 | 0.4 | 0.4 | 2.0 | 1.6 |
| GFCF | -0.3 | -0.1 | -0.9 | -1.1 | -0.8 | -1.9 |
| *of which Non financial corporated and unincorporated enterprises | 0.2 | 0.8 | -0.6 | -0.7 | -0.6 | -0.4 |
| Households | -1.8 | -2.1 | -2.7 | -2.5 | -3.1 | -6.9 |
| General government | 0.3 | -0.4 | 0.1 | -0.7 | 1.1 | -0.4 |
| Exports | -0.6 | 1.5 | 0.6 | 0.1 | 2.4 | 2.2 |
| Contributions : | ||||||
| Internal demand excluding inventory changes | 0.0 | 0.2 | -0.4 | 0.1 | 0.4 | -0.1 |
| Inventory changes | 0.3 | -0.3 | 0.5 | 0.0 | -0.2 | 0.4 |
| Net foreign trade | -0.4 | 0.3 | 0.0 | -0.1 | 0.1 | 0.0 |
tableauTab2 – Sectoral accounts
| 2013 Q3 | 2013 Q4 | 2014 Q1 | 2014 Q2 | 2013 | 2014 (ovhg) | |
|---|---|---|---|---|---|---|
| Profit ratio of NFC* (level) | 29.5 | 29.4 | 29.8 | 29.3 | 29.8 | |
| Household purchasing power | -0.3 | -0.3 | 0.9 | 0.5 | 0.0 | 1.0 |
- *NFC: non-financial corporations
tableauTab3 – Production, Consumption and GFCF : main components
| 2013 Q3 | 2013 Q4 | 2014 Q1 | 2014 Q2 | 2013 | 2014 (ovhg) | |
|---|---|---|---|---|---|---|
| Production of branches | -0.3 | 0.2 | 0.2 | -0.1 | 0.5 | 0.4 |
| Goods | -1.4 | -0.2 | 0.4 | -0.4 | -0.2 | -0.4 |
| Manufactured Industry | -1.4 | 0.1 | 0.8 | -0.9 | -0.6 | 0.0 |
| Construction | -0.5 | -0.3 | -1.5 | -1.7 | -1.2 | -3.1 |
| Market services | 0.2 | 0.4 | 0.3 | 0.2 | 0.9 | 1.0 |
| Non-market services | 0.3 | 0.4 | 0.4 | 0.3 | 1.5 | 1.3 |
| Household consumption | -0.1 | 0.2 | -0.6 | 0.4 | 0.3 | 0.0 |
| Food products | 0.5 | 0.9 | -1.0 | 0.9 | 0.1 | 0.3 |
| Energy | -3.7 | -1.4 | -3.9 | 3.4 | 0.8 | -4.1 |
| Engineered goods | 0.7 | 1.2 | 0.0 | -0.2 | -1.0 | 1.2 |
| Services | 0.1 | 0.1 | 0.2 | 0.1 | 0.6 | 0.5 |
| GFCF | -0.3 | -0.1 | -0.9 | -1.1 | -0.8 | -1.9 |
| Manufactured goods | 1.0 | 0.3 | -0.4 | -0.6 | -0.9 | -0.3 |
| Construction | -0.8 | -0.7 | -1.8 | -2.1 | -1.6 | -4.2 |
| Market services | -0.3 | 0.3 | 0.0 | 0.1 | 0.3 | 0.4 |
tableauTab4 – Households’ disposable income and ratios of households’ account
| 2013 Q3 | 2013 Q4 | 2014 Q1 | 2014 Q2 | 2013 | 2014 (ovhg) | |
|---|---|---|---|---|---|---|
| HDI | -0.1 | -0.3 | 1.3 | 0.5 | 0.6 | 1.4 |
| Household purchasing power | -0.3 | -0.3 | 0.9 | 0.5 | 0.0 | 1.0 |
| HDI by cu* (purchasing power) | -0.5 | -0.5 | 0.8 | 0.3 | -0.6 | 0.4 |
| Adjusted HDI (purchasing power) | -0.2 | -0.1 | 0.8 | 0.5 | 0.5 | 1.1 |
| Saving rate (level) | 15.1 | 14.6 | 15.9 | 15.9 | 15.1 | |
| Financial saving rate (level) | 5.9 | 5.5 | 7.0 | 7.3 | 5.8 |
- *cu: consumption unit
tableauTab5 – Ratios of non-financial corporations’ account
| 2013 Q3 | 2013 Q4 | 2014 Q1 | 2014 Q2 | 2013 | |
|---|---|---|---|---|---|
| Profit share | 29.5 | 29.4 | 29.8 | 29.3 | 29.8 |
| Investment ratio | 22.6 | 22.8 | 22.6 | 22.5 | 22.6 |
| Savings ratio | 16.7 | 17.1 | 17.0 | 17.0 | 17.1 |
| Self-financing ratio | 73.6 | 75.3 | 75.2 | 75.5 | 75.7 |
tableauTab6 – Expenditure, receipts and net borrowing of public administrations
| 2013 Q3 | 2013 Q4 | 2014 Q1 | 2014 Q2 | 2013 | |
|---|---|---|---|---|---|
| In billions of euros | |||||
| Total expenditure | 303.3 | 305.0 | 307.7 | 308.9 | 1207.7 |
| Total receipts | 281.8 | 284.1 | 286.0 | 285.1 | 1120.4 |
| Net lending (+) or borrowing (-) | -21.5 | -20.9 | -21.7 | -23.7 | -87.2 |
| In % of GDP | |||||
| Net lending (+) or borrowing (-) | -4.1 | -3.9 | -4.1 | -4.4 | -4.1 |
In Q2 2014, consumption prices stability (0.0% after +0.3% in Q1) attenuated the deceleration of households’ purchasing power, which rose by 0.5% (after +0.9%). Measured per consumption unit, households’ purchasing power increased by 0.3% (after +0.8%).
Household consumption in value rose at a rate which is close to the HDI growth (+0.4% after –0.2%). Therefore the saving ratio is also stable, at 15.9%.
Non financial corporations’ profit ratio decreased by 0.5 points at 29.3%
In Q2 2014, non financial corporations’ value added declined (–0.4% in value after +0.1%). Wages paid (including social contributions) decelerated sharply but increased again: +0.2% after +0.7%. In Q2, subsidies on production slowed after an increase in Q1 following the implementation of the CICE. As a result, non financial corporations’ margin rate droped by 0.5 points to 29.3%.
In Q2, general government deficit represented 4.4% of GDP
In Q2, general government deficit requirement was up by 0.3 points of GDP, from 4.1% to 4.4% of GDP. Receipts declined (–0.3% after +0.7% in Q1) notably because of lower receipts from corporate taxes, while expenditures slowed (+0.4% after +0.9%) as the strong Q1 increase was linked to the establishment of the CICE.
This publication includes the new estimation of the general government deficit for 2013, of 4.1% of GDP against 4.2% previously. This revision contributes to the revision of the deficit of Q1 2014 (from 4.4% to 4.1% of GDP). The quarterly general government deficit estimation is not merely accounting data but statistical data which may be revised in future publications.
Pour en savoir plus
