


 22 May 2014
2014- n° 119In May 2014, the business climate remains deteriorated in services Monthly survey of services - May 2014
22 May 2014
2014- n° 119In May 2014, the business climate remains deteriorated in services Monthly survey of services - May 2014
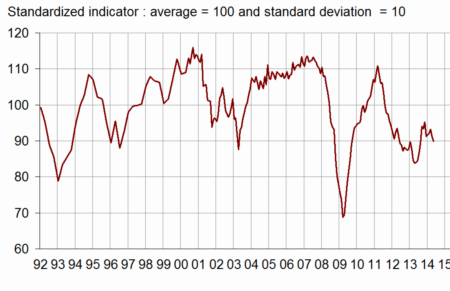
According to business managers, the economic situation in services remains damaged in May 2014. The business climate composite indicator is almost steady and stands at 90, still below its long-term average (100). The turning point indicator remains in a favorable area.
All services sector
According to business managers, the economic situation in services remains damaged in May 2014. The business climate composite indicator is almost steady and stands at 90, still below its long-term average (100). The turning point indicator remains in a favorable area.
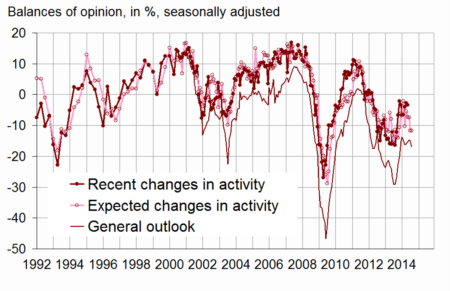
Business managers consider that activity remains dull in the recent period. Their expectations of activity and demand for the next three months are pessimistic. The balance on the general outlook, which relates the assessment of business leaders over their whole sector, has dropped by two points. It remains below its long-term average.
Employment expectations remain pessimistic
In services sector except temporary employment agencies, the balances of opinion on past and expected employment are lower than their long-term averages.
tableauTable_quarter – Economic outlook in the services sector
| Average* | Feb. 14 | March 14 | April 14 | May 14 | |
|---|---|---|---|---|---|
| Composite indicator | 100 | 92 | 93 | 91 | 90 |
| General outlook | –8 | –15 | –15 | –15 | –17 |
| Past activity | 2 | –7 | –4 | –3 | –3 |
| Expected activity | 2 | –7 | –7 | –12 | –12 |
| Expected demand | 0 | –9 | –6 | –8 | –11 |
| Business situation | –2 | –13 | –10 | –7 | –6 |
| Past selling prices | –3 | –10 | –13 | –10 | –11 |
| Expected selling prices | –2 | –11 | –12 | –9 | –10 |
| Past employment | 3 | –2 | –5 | 3 | 3 |
| except temporary work agencies | 1 | –1 | –4 | 0 | –2 |
| Expected employment | 2 | –4 | –2 | –1 | –5 |
| except temporary work agencies | –1 | –8 | –5 | –3 | –4 |
| Investments | |||||
| Past investments | 1 | –2 | 1 | –3 | –4 |
| Expected investments | 1 | –5 | –6 | –4 | –5 |
- * Average of the balances of opinion since 1988
- Source: Insee
graphiqueGraph1 – Composite indicator
graphiquegraph_retourn – Turning point indicator
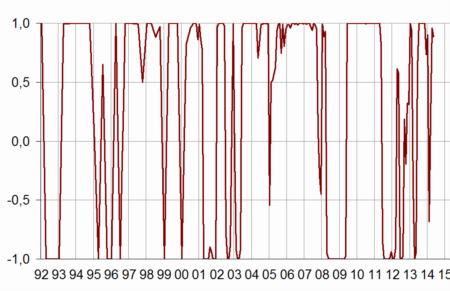
- Note: close to 1 (respectively -1), this indicator indicates a favorable short-term economic situation (respectively unfavorable).
graphiqueGraph2 – Activity
Road transport
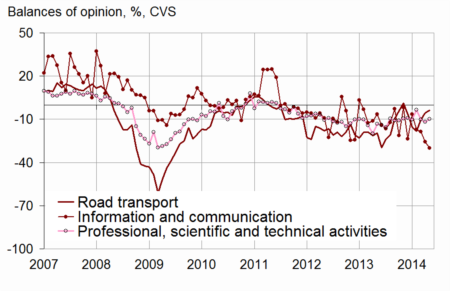
In road freight and mail activities, the balance of opinion on past activity has declined. The balance of opinion on expected activity continues to increase and exceeds its long-term average.
Accommodation and food service activities
In accommodation and food service activities, business managers consider that their activity is dull over the recent period. Their business expectations over the coming months are downward oriented.
Information and communication
In information and communication, less business managers than in April consider that their activity has deteriorated over the recent period. However, their business expectations are very pessimistic.
Real estate activities
In real estate activities, the balance of opinion on past activity is almost at its average level. The balance of opinion on expected activity has increased again, while business managers do not expect much demand.
Professional, scientific and technical activities
In professional, scientific and technical activities, business managers consider that activity has slightly slowed down in the recent months. Their expectations of business and demand are pessimistic.
Administrative and support service activities
In administrative and support service activities, the balance of opinion on past activity regains its long-term average after a jump in April. The balances of opinion relative to expected activity and expected demand remain deteriorated.
graphiquegraph_bonus_ – Expected activity
tableauTable_det – Detailed data
| A21 | Average* | Feb. 14 | March 14 | April 14 | May 14 |
|---|---|---|---|---|---|
| (H) Road transport | |||||
| Past activity | –8 | 3 | 3 | –10 | –13 |
| Expected activity | –9 | –18 | –10 | –6 | –4 |
| Expected demand | –13 | –18 | –12 | –13 | –15 |
| Past employment | –8 | –6 | –8 | –10 | –11 |
| Expected employment | –11 | –16 | –11 | –8 | –9 |
| (I) Accommodation and food service activities | |||||
| Past activity | –7 | –14 | –5 | –11 | –11 |
| Expected activity | –7 | –21 | –12 | –9 | –15 |
| Expected demand | –9 | –25 | –29 | –22 | –21 |
| Past employment | –4 | –6 | –4 | –12 | –9 |
| Expected employment | –5 | –12 | –6 | 1 | –15 |
| (J) Information and communication | |||||
| Past activity | 10 | –24 | –19 | –7 | –5 |
| Expected activity | 11 | –17 | –19 | –26 | –30 |
| Expected demand | 12 | –4 | 7 | –7 | –7 |
| Past employment | 7 | –1 | –10 | –2 | –6 |
| Expected employment | 11 | –6 | –1 | 4 | 1 |
| (L) Real estate activities | |||||
| Past activity | 7 | 9 | 11 | 0 | 9 |
| Expected activity | 7 | 5 | 5 | 7 | 11 |
| Expected demand | 1 | –3 | –2 | –2 | –7 |
| Past employment | 3 | 7 | –1 | 8 | 0 |
| Expected employment | 2 | –1 | –5 | –1 | –1 |
| (M) Professional, scientific and technical activities | |||||
| Past activity | –1 | –7 | –1 | –2 | –5 |
| Expected activity | –2 | –3 | –10 | –12 | –10 |
| Expected demand | –5 | –11 | –15 | –12 | –14 |
| Past employment | 1 | –5 | –3 | 1 | 1 |
| Expected employment | 0 | –5 | –5 | –4 | –1 |
| (N) Administrative and support service activities | |||||
| Past activity | 6 | 4 | 2 | 16 | 6 |
| Expected activity | 5 | 3 | 10 | –7 | –5 |
| Expected demand | 3 | 0 | 0 | 0 | –4 |
| Past employment | 8 | 1 | –7 | 15 | 15 |
| Expected employment | 6 | 3 | 4 | –2 | –2 |
- * Average of the balances of opinion since 1988 (2006 for road transport)
Documentation
Methodology (2016) (pdf,158 Ko)
Pour en savoir plus
Time series : Economic outlook surveys – Services
