


 22 May 2014
2014- n° 118In May 2014, the business climate remains stable in the retail trade and in the trade
and repair of motor vehicles Monthly survey of retailing - May 2014
22 May 2014
2014- n° 118In May 2014, the business climate remains stable in the retail trade and in the trade
and repair of motor vehicles Monthly survey of retailing - May 2014
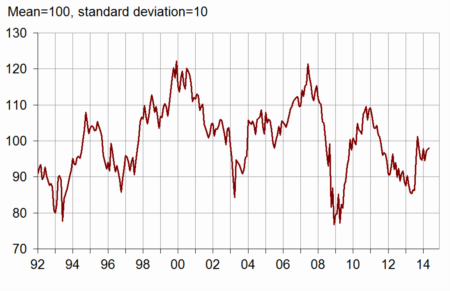
According to the managers surveyed in May 2014, the business climate remains stable in the retail trade and in the trade and repair of motor vehicles. The composite indicator has stayed still below its long-term average level.
According to the managers surveyed in May 2014, the business climate remains stable in the retail trade and in the trade and repair of motor vehicles. The composite indicator has stayed still below its long-term average level.
graphiquegraph_indsynt_en – Business climate synthetic indicator
Stability in general business outlook
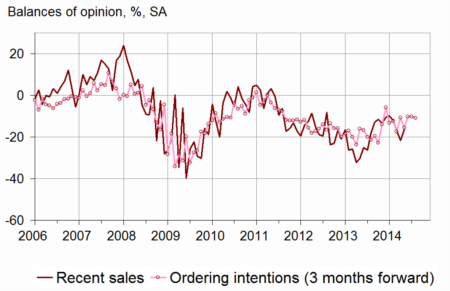
More business leaders than last month have declared a recovery in their past sales, mainly due to the improvement in the motor vehicles sector. However, the overall balance is still under its average. About forecasts, each of the two balances concerning expected sales and ordering intentions is almost stable under its mean level. The general outlook balance is under its average, stable for the fourth month in a row, showing that the managers remain rather pessimistic about the economic situation in the trade sector.
In May, more business leaders have declared a fall in past selling prices, these trend mainly due to the retail trade sector business leaders. As many business leaders than in April forecast a fall in prices.
graphiqueGraph_ventes_ic_en – Recent sales and ordering intentions
tableautab1_en – Global data
| Ave. (1) | Feb 14 | Mar. 14 | Apr. 14 | May 14 | |
|---|---|---|---|---|---|
| Business climate | 100 | 95 | 97 | 98 | 98 |
| General business outlook | –30 | –36 | –36 | –36 | –36 |
| Recent sales | –7 | –12 | –17 | –22 | –16 |
| Expected sales | –3 | –14 | –12 | –7 | –9 |
| Ordering intentions | –9 | –16 | –10 | –10 | –11 |
| Stocks | 11 | 8 | 3 | 4 | 6 |
| Past selling prices (2) | –6 | –9 | –18 | ||
| Expected selling prices | –3 | –10 | –12 | –16 | –16 |
| Cash position (2) | –15 | –22 | –19 | ||
| Workforce size: recent trend | 0 | –5 | –7 | –4 | –4 |
| Workforce size: future trend | –2 | –8 | –8 | –4 | –3 |
- (1) Average since 1991 (2004 for recent and expected sales and ordering intentions).
- (2) Bi-monthly question (odd-numbered months).
- Source: monthly survey in the retail trade and in the trade and repair of motor vehicles - INSEE
Stability in job losses
According to business managers, job losses pace stabilizes over the last and the next few months. Each of the two balances still stay under its average.
Retail trade
Very low estimated prices
Less non-specialized retailers than in the last survey have declared a fall in their past activity, but the corresponding balance is still very low. Each of the two balances concerning expected sales and ordering intentions remains slightly below its mean level.
More specialized retailers than in April have declared a decrease in their past and expected activities and in their ordering intentions. Each of the three balances is from now under its average.
Overall, stocks are estimed below their normal level.
In both non-specialized and specialized trade, the balances concerning past and expected prices are very low. In non-specialized trade, they have come back to mid-2009 level.
Trade and repair of motor vehicles
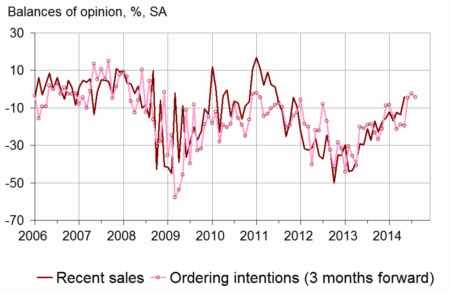
graphiquegraph_ventes_ic_auto_en – Recent sales and ordering intentions in motor vehicles
Still optimistic ordering intentions
In trade and repair of motor vehicles, past activity has sped up, the corresponding balance going above its average and coming back to the end of 2011 level. If expected sales have slightly decline, ordering intentions have remained optimistic.
The level of stocks is still considered very low.
The balances concerning prices are rather stable.
The cash flow situation has been estimed a little easier than in March.
tableautab2_en – Detailed data
| Ave. (1) | Feb 14 | Mar. 14 | Apr. 14 | May 14 | |
|---|---|---|---|---|---|
| Retail trade - Global data | |||||
| Recent sales | –5 | –10 | –19 | –25 | –21 |
| Expected sales | 0 | –14 | –12 | –6 | –8 |
| Ordering intentions | –7 | –14 | –11 | –10 | –11 |
| Stocks | 10 | 8 | 4 | 5 | 7 |
| Past selling prices (2) | –8 | –14 | –24 | ||
| Expected selling prices | –5 | –12 | –13 | –22 | –22 |
| Cash position (2) | –13 | –21 | –19 | ||
| Workforce size: recent trend | 1 | –2 | –5 | –1 | 0 |
| Workforce size: future trend | –2 | –6 | –5 | –3 | 0 |
| Non-specialized retail trade | |||||
| Recent sales | –1 | –9 | –17 | –33 | –24 |
| Expected sales | 6 | –13 | –12 | –2 | 1 |
| Ordering intentions | 1 | –10 | –8 | –2 | –2 |
| Stocks | 7 | 9 | 3 | 2 | 1 |
| Past selling prices (2) | –8 | –22 | –32 | ||
| Expected selling prices | –5 | –16 | –20 | –27 | –27 |
| Cash position (2) | –7 | –14 | –12 | ||
| Specialized retail trade | |||||
| Recent sales | –9 | –11 | –21 | –16 | –18 |
| Expected sales | –7 | –18 | –16 | –11 | –18 |
| Ordering intentions | –17 | –21 | –19 | –16 | –24 |
| Stocks | 14 | 8 | 4 | 9 | 13 |
| Past selling prices (2) | –8 | –5 | –15 | ||
| Expected selling prices | –4 | –7 | –6 | –16 | –17 |
| Cash position (2) | –22 | –28 | –27 | ||
| Trade and repair of motor cars and motorcycles | |||||
| Recent sales | –11 | –17 | –12 | –14 | –4 |
| Expected sales | –9 | –16 | –10 | –7 | –12 |
| Ordering intentions | –14 | –20 | –4 | –2 | –4 |
| Stocks | 15 | 6 | 0 | 3 | 5 |
| Past selling prices (2) | 1 | 1 | –4 | ||
| Expected selling prices | 4 | –9 | –7 | –3 | 1 |
| Cash position (2) | –26 | –26 | –21 | ||
| Workforce size: recent trend | –10 | –16 | –14 | –13 | –15 |
| Workforce size: future trend | –8 | –14 | –13 | –5 | –11 |
- (1) Average since 1991 (2003 for trade and repair of motor vehicles and 2004 for recent and expected sales and ordering intentions).
- (2) Bi-monthly question (odd-numbered months).
- Source: monthly survey in the retail trade and in the trade and repair of motor vehicles - INSEE
Documentation
Methodology (pdf,129 Ko)
Pour en savoir plus
