


 20 December 2013
2013- n° 292In December 2013, the business climate is deteriorating in services Monthly survey of services - December 2013
20 December 2013
2013- n° 292In December 2013, the business climate is deteriorating in services Monthly survey of services - December 2013
According to business managers, the economic situation in services is deteriorating in December 2013. The business climate composite indicator drops by four points and is 91, still below its long-term average (100). However, it remains seven points higher than its low point in April. Anyway, the turning point indicator still indicates a favorable economic outlook dynamic.
All services sector
According to business managers, the economic situation in services is deteriorating in December 2013. The business climate composite indicator drops by four points and is 91, still below its long-term average (100). However, it remains seven points higher than its low point in April. Anyway, the turning point indicator still indicates a favorable economic outlook dynamic.
Business managers consider that their activity has worsened in the last few months. They revise downward their anticipations of activity and demand for the next few months. The general outlook remains below its long-term average.
Employment expectations decline
In services sector except temporary employment agencies, the balance of opinion on past employment is less deteriorated than in November, but the one on expected employment is down.
tableauTable_quarter – Economic outlook in the services sector
| Average* | Sept. 13 | Oct. 13 | Nov. 13 | Dec. 13 | |
|---|---|---|---|---|---|
| Composite indicator | 100 | 94 | 93 | 95 | 91 |
| General outlook | –7 | –15 | –14 | –15 | –17 |
| Past activity | 2 | –12 | –7 | –2 | –5 |
| Expected activity | 2 | –6 | –7 | –2 | –9 |
| Expected demand | 0 | –2 | –2 | –5 | –9 |
| Business situation | –2 | –10 | –11 | –9 | –14 |
| Past selling prices | –3 | –10 | –12 | –13 | –11 |
| Expected selling prices | –2 | –10 | –10 | –7 | –10 |
| Past employment | 3 | –1 | –4 | 2 | 7 |
| except temporary work agencies | 1 | –6 | –7 | –5 | –2 |
| Expected employment | 2 | –1 | 0 | –2 | –4 |
| except temporary work agencies | 0 | –8 | –6 | –5 | –8 |
| Investments | |||||
| Past investments | 1 | –5 | –3 | 1 | 0 |
| Expected investments | 1 | 1 | 0 | –1 | –1 |
- * Average of the balances of opinion since 1988
- Source: Insee
graphiqueGraph1 – Composite indicator

graphiquegraph_retourn – Turning point indicator

- Note: close to 1 (respectively -1), this indicator indicates a favorable short-term economic situation (respectively unfavorable).
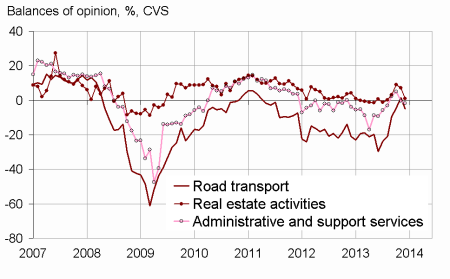
graphiqueGraph2 – Activity

Road transport
In road freight and mail activities, the balance of opinion on past activity continues to rise. On the contrary, the balance of opinion on expected activity decreases but remains above its long term average.
Accommodation and food service activities
In accommodation and food service activities, business managers consider that activity has deteriorated in the past three months. Their business and demand expectations stay unchanged from November.
Information and communication
In information and communication, the balances of opinion on past activity and on expected activity relapse.
Real estate activities
In real estate activities, the balance on past activity is virtually unchanged and remains below its long-term average. Business managers remain pessimistic in their expectations of activity and demand.
Professional, scientific and technical activities
In professional, scientific and technical activities, business managers consider that their activity has declined in recent months. Their forecasts of activity and demand remain grim.
Administrative and support service activities
In administrative and support service activities, business managers indicate that activity and employment have improved in the recent period. Nevertheless, their expectations of activity and demand for the next three months are pessimistic.
graphiquegraph_bonus_ – Expected activity
tableauTable_det – Detailed data
| A21 | Average* | Sept. 13 | Oct. 13 | Nov. 13 | Dec. 13 |
|---|---|---|---|---|---|
| (H) Road transport | |||||
| Past activity | –8 | –19 | –8 | –6 | –4 |
| Expected activity | –9 | –10 | –4 | 1 | –5 |
| Expected demand | –13 | –13 | –7 | –8 | –9 |
| Past employment | –8 | –11 | –6 | –7 | –1 |
| Expected employment | –11 | –11 | –6 | –7 | –14 |
| (I) Accommodation and food service activities | |||||
| Past activity | –7 | –19 | –19 | –12 | –17 |
| Expected activity | –7 | –21 | –8 | –13 | –13 |
| Expected demand | –9 | –14 | –8 | –15 | –16 |
| Past employment | –4 | –11 | –14 | –13 | –6 |
| Expected employment | –5 | –13 | –11 | –10 | –11 |
| (J) Information and communication | |||||
| Past activity | 10 | –28 | –10 | –1 | –13 |
| Expected activity | 12 | –3 | –21 | –2 | –22 |
| Expected demand | 12 | 11 | 5 | 5 | –5 |
| Past employment | 7 | –16 | –9 | –4 | –2 |
| Expected employment | 12 | –5 | 1 | 2 | –3 |
| (L) Real estate activities | |||||
| Past activity | 7 | 4 | 0 | –3 | –4 |
| Expected activity | 7 | 3 | 9 | 7 | 1 |
| Expected demand | 1 | 0 | 2 | –4 | –7 |
| Past employment | 3 | –1 | –5 | 0 | 1 |
| Expected employment | 2 | –5 | –2 | 2 | –2 |
| (M) Professional, scientific and technical activities | |||||
| Past activity | –1 | –9 | –3 | –6 | –10 |
| Expected activity | –2 | –11 | –11 | –9 | –8 |
| Expected demand | –5 | –12 | –10 | –12 | –13 |
| Past employment | 1 | –6 | –6 | 1 | 1 |
| Expected employment | 0 | –7 | –5 | –4 | –7 |
| (N) Administrative and support service activities | |||||
| Past activity | 6 | –3 | 1 | 6 | 8 |
| Expected activity | 5 | 2 | 5 | 0 | –2 |
| Expected demand | 3 | 1 | 0 | –5 | –7 |
| Past employment | 8 | 13 | 2 | 22 | 29 |
| Expected employment | 6 | 13 | 10 | 3 | 4 |
- * Average of the balances of opinion since 1988 (2006 for road transport)
Documentation
Methodology (2016) (pdf,158 Ko)
Pour en savoir plus
Time series : Economic outlook surveys – Services
