


 12 September 2013
2013- n° 209In August 2013, prices of frequently purchased goods in hyper and supermarkets increased
by 0.2% Price Index in large and predominantly-food stores - August of 2013
12 September 2013
2013- n° 209In August 2013, prices of frequently purchased goods in hyper and supermarkets increased
by 0.2% Price Index in large and predominantly-food stores - August of 2013
In hyper and supermarkets, the prices of frequently purchased goods rose by 0.2% in August 2013 after a decline by 0.1% in July 2013.
- Year-on-year, prices grew by 0.3% in the hyper and supermarkets
- Prices increased by 0.2% in the hyper and supermarkets in August
- Excluding fresh foodstuffs, the food and beverage prices were up 0.2% in the hyper and supermarkets in August
- The prices of cleaning and personal care products decreased in August 2013 in the hyper and supermarkets
In hyper and supermarkets, the prices of frequently purchased goods rose by 0.2% in August 2013 after a decline by 0.1% in July 2013.
Year-on-year, prices grew by 0.3% in the hyper and supermarkets
In August 2013, the prices of frequently purchased goods were 0.3% higher than those of August 2012 in the hyper and supermarkets (after + 0.2% in July 2013). They were up 1.4%, year on year, in August 2012.
Prices increased by 0.2% in the hyper and supermarkets in August
In hypermarkets, the prices of frequently purchased goods in hypermarkets went up by 0.2% in August 2013. They decreased by 0.2% in July 2013.
Between August 2012 and August 2013, the prices of frequently purchased goods in hypermarkets went up by 0.2%, like between July 2012 and July 2013. In August 2012, they increased by 1.1%, year on year.
In supermarkets, the prices of frequently purchased goods were up 0.2% in August 2013 after a rise by 0.1% in July 2013.
Between August 2012 and August 2013, the prices of frequently purchased goods have risen by 0.5% in supermarkets after + 0.6% between July 2012 and July 2013. In August 2012, they increased by 1.6%, year on year.
graphiqueGraphique1 – Frequently purchased goods price indexes - annual changes (%)
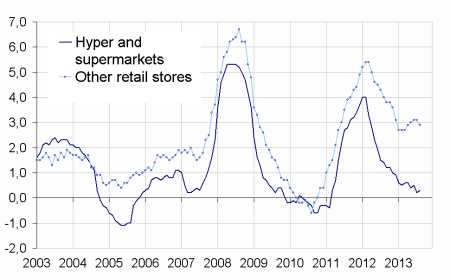
- Source : INSEE – Consumer Price Indeces, base 100 : 1998
graphiqueGraphique2 – Frequently purchased goods price indexes
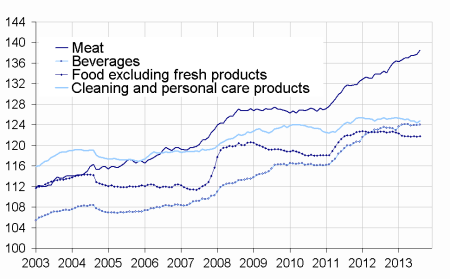
- Source : INSEE – Consumer Price Indeces, base 100 : 1998
tableauTableau1 – Prices of frequently purchased goods
| Variations (%) over | |||
|---|---|---|---|
| Index August 2013 | one month | 12 last months | |
| Hyper-and-Supermarkets (A) | 126,4 | 0,2 | 0,3 |
| - Hypermarkets | 125,5 | 0,2 | 0,2 |
| - Supermarkets | 128,2 | 0,2 | 0,5 |
| Large and predominantly food stores (A + neighborhood stores) | 128,0 | 0,2 | 0,5 |
| Other | 137,9 | 0,2 | 2,9 |
| Total | 130,0 | 0,2 | 0,9 |
- Source : INSEE – Consumer Price Indeces
tableauTableau2 – Prices of frequently purchased goods detailed by main items
| Variations (%) over | |||
|---|---|---|---|
| Index August 2013 | one month | 12 last months | |
| Food and beverages (excluding fresh foodstuffs) | 126,8 | 0,2 | 0,5 |
| - Meat | 138,5 | 0,6 | 3,0 |
| - Beverages | 124,0 | 0,1 | 0,3 |
| - Other food products | 121,8 | 0,1 | –0,7 |
| Clearing and personal care products | 124,7 | 0,2 | –0,6 |
| Total : Hyper-and-Supermarkets | 126,4 | 0,2 | 0,3 |
- Source : INSEE – Consumer Price Indeces
Excluding fresh foodstuffs, the food and beverage prices were up 0.2% in the hyper and supermarkets in August
Excluding fresh foodstuffs, the food and beverage prices rose by 0.2% in the hyper and supermarkets in August 2013 while they were stable in July 2013. Between August 2012 and August 2013, they increased by 0.5 %, as they did between July 2012 and July 2013. Compared with the same month one year ago, the food and beverage prices (excluding fresh foodstuffs) grew by 1.4% in August 2012.
In August 2013, meat prices went up by 0.6% in the hyper and supermarkets (+ 0.1% in July 2013). They increased by 3.0% in August 2013, year on year (+ 2.8% in July 2013). In August 2012, they went up by 2.0%, year on year.
In the hyper and supermarkets, beverage prices went up by 0.1% in August 2013; they were stable in July 2013. Between August 2012 and August 2013, beverage prices rose by 0.3% (+ 0.5% between July 2012 and July 2013). In August 2012, they grew by 3.0%, year on year.
In August 2013, excluding fresh foodstuffs, the prices of other food products increased by 0.1% after a decline (– 0.1%) in July 2013. They dipped by 0.7%, year on year in August 2013 (— 0.8% in July 2013). Between August 2012 and August 2011, they have risen by 0.6%.
The prices of cleaning and personal care products decreased in August 2013 in the hyper and supermarkets
In August 2013, the prices of cleaning and personal care products were up 0.2% in the hyper and supermarkets while they decreased by 0.2% in July 2013. They decreased by 0.6%, year on year, (like in July 2013). In August 2012, they went up 0.7%, year on year.
Pour en savoir plus
