


 29 June 2011
2011- n° 160In Q1, French GDP markedly accelerated (+0.9% after +0.3%) while households’ purchasing
power decelerated (+0.2% after +0.4%) Quarterly national accounts - detailed figures - 1st Quarter 2011
29 June 2011
2011- n° 160In Q1, French GDP markedly accelerated (+0.9% after +0.3%) while households’ purchasing
power decelerated (+0.2% after +0.4%) Quarterly national accounts - detailed figures - 1st Quarter 2011
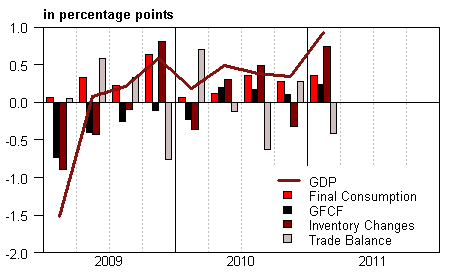
In 2011 Q1*, French GDP increased by 0.9% in volume**, after +0.3% in the previous quarter.
In 2011 Q1*, French GDP increased by 0.9% in volume**, after +0.3% in the previous quarter.
Households’ consumption expenditure increased at the same rate as the previous quarter (+0.4%). Gross fixed capital formation (GFCF) markedly accelerated (+1.2% after +0.5%).
Overall, total domestic demand (excluding inventory changes) drove GDP on for 0.6 point of growth after 0.4 the previous quarter.
Imports renewed with growth (+3.0% after –0.4%), and increase more sharply than exports (+1.8% after +0.7%). Consequently, foreign trade balance contributed negatively to GDP growth anew (–0.4 point after +0.3 point). This is overcompensated by inventory changes which contributed +0.7 point to GDP growth after –0.3 point.
GDP growth estimation is slightly downscaled
GDP gorwth estimation for Q1 is marginally revised, yet the rounded figure is now +0.9% against +1.0% in the previous release. This revision is partly imputable to the revision of some indicators available in May (notably for production and households’ consumption), and to the integration of informations known after the first publication.
* In May 13 th , quarterly national accounts switched to a new reference year and nomenclature. Data were available since 1980, they are now since 1949.
** This growth rate is seasonally and trading-day adjusted; volumes are chain-linked previous-year-prices volumes.
graphiqueGraph1 – GDP and its main components
tableauTab1 – GOODS AND SERVICES: RESOURCES AND USES CHAIN-LINKED VOLUMES
| 2010 Q2 | 2010 Q3 | 2010 Q4 | 2011 Q1 | 2010 | 2011 (ovhg) | |
|---|---|---|---|---|---|---|
| GDP | 0.5 | 0.4 | 0.3 | 0.9 | 1.4 | 1.5 |
| Imports | 3.4 | 4.3 | -0.4 | 3.0 | 8.3 | 5.7 |
| Households' consumption expenditure | 0.1 | 0.5 | 0.4 | 0.4 | 1.3 | 1.0 |
| General government's consumption expenditure | 0.2 | 0.3 | 0.1 | 0.4 | 1.2 | 0.7 |
| GFCF | 1.0 | 0.9 | 0.5 | 1.2 | -1.4 | 2.3 |
| of which Non financial corporated and unincorporated enterprises | 2.6 | 1.4 | 1.0 | 1.9 | 2.0 | 4.0 |
| Households | 0.1 | 1.9 | 0.9 | -0.2 | -1.4 | 1.4 |
| General government | -1.9 | -1.9 | -1.4 | 1.4 | -9.7 | -1.0 |
| Exports | 3.1 | 2.0 | 0.7 | 1.8 | 9.4 | 4.1 |
| Contributions : | ||||||
| Internal demand excluding inventory changes | 0.3 | 0.5 | 0.4 | 0.6 | 0.8 | 1.2 |
| Inventory changes | 0.3 | 0.5 | -0.3 | 0.7 | 0.5 | 0.8 |
| Net foreign trade | -0.1 | -0.6 | 0.3 | -0.4 | 0.1 | -0.6 |
tableauTab2 – Sectoral accounts
| 2010 Q2 | 2010 Q3 | 2010 Q4 | 2011 Q1 | 2010 | 2011 (ovhg) | |
|---|---|---|---|---|---|---|
| Profit ratio of NFC* (level) | 30.1 | 30.3 | 29.7 | 29.9 | 30.1 | |
| Household purchasing power | 0.3 | 0.6 | 0.4 | 0.2 | 0.8 | 0.9 |
- *NFC : non-financial corporations
tableauTab5 – Household disposable income and household account ratios
| 2010 Q2 | 2010 Q3 | 2010 Q4 | 2011 Q1 | 2010 | 2011 (ovhg) | |
|---|---|---|---|---|---|---|
| HDI | 0.6 | 0.8 | 1.0 | 0.9 | 2.0 | 2.2 |
| Household purchasing power | 0.3 | 0.6 | 0.4 | 0.2 | 0.8 | 0.9 |
| HDI by ci* (purchasing power) | 0.1 | 0.4 | 0.3 | 0.0 | 0.1 | 0.4 |
| Adjusted HDI (purchasing power) | 0.3 | 0.5 | 0.4 | 0.3 | 0.8 | 0.9 |
| Saving rate (level) | 16.0 | 16.1 | 16.1 | 15.9 | 16.1 | |
| Financial saving rate (level) | 7.1 | 7.0 | 7.0 | 6.8 | 7.0 |
- * ci : consumption unit
Households’ purchasing power decelerated
As employment and average wage per capita accelerated, households’ income were more dynamic (+1.1% after +0.9%). Social benefits in cash also accelerated (+0.8% after +0.4%). Yet, taxes on income and wealth grew rapidly (+3.0%), after having stepped back by the end of 2010 due to end-of-year adjustments. Overall, households ‘disposable income slightly decelerrated (+0.9% after +1.0%).
Consumption prices increased more rapidly than the previous quarter (+0.7% after +0.5%) due to energy prices. All in all, households’ purchasing power decelerated (+0.2% after +0.4%). Taken per consumption unit, it was stable.
Consumption in nominal terms increasing faster (+1.2%) than nominal income, the saving rate stepped back (15.9% after 16.1% in 2010 Q4).
Non-financial corporations profit ratio marginally increased
Non-financial corporations’ value added markedly accelerated (+1.8% after +0.2%). Wages paid (including employers social contributions) accelerated though less markedly (+1.3% after +0.9%) : employment (+0.5% after +0.3%) and wage per capita (+1.0% after +0.6%) both accelerated. Payroll taxes and other taxes on production increased (+3.8% after +1.0%), due in particular to the progressive replacement of the local business tax.
All in all, the increase of value added has been higher than that of wages and taxes. As a consequence gross operating surplus increased (+2.3% after –1.7%), the increase was higher than that of value added. Consequently, non-financial corporations’ profit ratio increased by 0.2 point to reach 29.9% this quarter.
Pour en savoir plus
