


 1 June 2011
2011- n° 139Decrease in the unemployment rate in Q1 2011 ILO Unemployment and Labour Market-related indicators (Labour Force Survey results)
- 1st Quarter 2011
1 June 2011
2011- n° 139Decrease in the unemployment rate in Q1 2011 ILO Unemployment and Labour Market-related indicators (Labour Force Survey results)
- 1st Quarter 2011
In Q1 2011, the average ILO unemployment rate in metropolitan France and overseas departments stood at 9.7% of the active population. In metropolitan France only, 9.2% of the active population was unemployed, i.e. 2.6 million people. The unemployment rate decreased by 0.1 point q-o-q, and 0.3 point y-o-y.

Warning: In Q1 2011, the Eurostat concepts of age and activity for trainees were adopted. Age is now defined on the week people are interviewed, and not anymore at the end of the year. Trainees are considered as employed if they get paid, and no more if their job is similar to their colleagues. Historical data are available with these concepts.
The unemployment rate
The unemployment rate decreased in Q1 2011
In Q1 2011, the average ILO unemployment rate in metropolitan France and overseas departments stood at 9.7% of the active population.
In metropolitan France only, 9.2% of the active population was unemployed, i.e. 2.6 million people. The unemployment rate decreased by 0.1 point q-o-q, and 0.3 point y-o-y.
More generally, in metropolitan France, 3.4 million people did not work but would like to work, whether they are available or not for work within two weeks, or whether they look actively for a job or not (see additional indicators on the internet).
graphiquegraph_cho_nvIR – ILO-unemployment rate

- Estimation close to +/-0.3 point of the unemployment rate
- Estimation close to +/-0.3 point of the quaterly variation of the unemployment rate
- France = Metropolitan France + overseas departments
- Covers the population of people living in households, people aged 15 years or more
- Source: INSEE, Labour Force Survey
tableautab_cho_nvIR – Ilo-unemployment rate in metropolitan France
| ILO-unemployment rate (%) | Variation in point | Thousands | |||
|---|---|---|---|---|---|
| 2010Q4 | 2011Q1 (p)* | over quarter | over year | 2011Q1 (p)* | |
| Total | 9,3 | 9,2 | –0,1 | –0,3 | 2 618 |
| 15-24 years | 22,2 | 22,8 | 0,6 | –0,2 | 656 |
| 25-49 years | 8,4 | 8,3 | –0,1 | –0,2 | 1 510 |
| 50 years and more | 6,3 | 6,3 | 0,0 | –0,2 | 452 |
| Men | 8,6 | 8,6 | 0,0 | –0,7 | 1 274 |
| 15-24 years | 20,7 | 21,1 | 0,4 | –2,6 | 332 |
| 25-49 years | 7,6 | 7,6 | 0,0 | –0,5 | 725 |
| 50 years and more | 6,0 | 5,8 | –0,2 | –0,5 | 217 |
| Women | 10,0 | 9,9 | –0,1 | 0,2 | 1 344 |
| 15-24 years | 24,1 | 25,0 | 0,9 | 2,8 | 324 |
| 25-49 years | 9,2 | 9,0 | –0,2 | 0,1 | 785 |
| 50 years and more | 6,6 | 6,7 | 0,1 | 0,0 | 235 |
- *(p) = provisional results
- Covers the population of people living in households in metropolitan France, people aged 15 years or more
- Source: INSEE, Labour Force Survey
ILO employment and activity
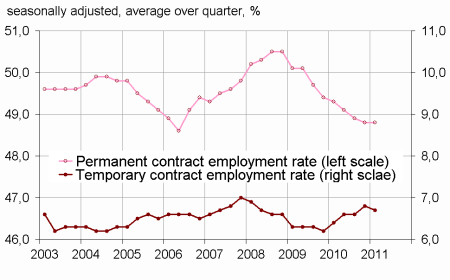
graphiquegraph_partpop_nvIR – Permanent and temporary contract employment rate (15-64 years)
- Covers the population of people living in households, people aged 15-64 years
- Source: INSEE, Labour Force Survey
Permanent contracts was stable in Q1 2011, at 48.8% of the population aged 15-64. Temporary contracts decreased by 0,1 point, at 6.7%.
tableautab_partpop_nvIR – ILO employment, unemployment and activity in the population aged 15-64 years
| % of people in the age group | Variation in point | Thousands (1) | |||
|---|---|---|---|---|---|
| 2010Q4 | 2011Q1 (p)* | Over quarter | Over year | 2011Q1 (p)* | |
| Employed people (15-64 years) | 63,8 | 63,8 | 0,0 | –0,1 | 25 562 |
| Full-time equivalent employment rate | 59,4 | 59,5 | 0,1 | 0,1 | 23 825 |
| Men aged 15-64 | 68,2 | 68,3 | 0,1 | 0,2 | 13 447 |
| Women aged 15-64 | 59,4 | 59,5 | 0,1 | –0,3 | 12 115 |
| 15-24 years | 30,2 | 29,8 | –0,4 | –0,7 | 2 217 |
| 25-49 years | 81,7 | 81,9 | 0,2 | –0,1 | 16 751 |
| 50-64 years | 54,1 | 54,2 | 0,1 | 0,6 | 6 594 |
| Included : 55-64 years | 40,1 | 40,3 | 0,2 | 1,1 | 3 226 |
| Core employment rate of 55-64 years | 39,7 | 40,2 | 0,5 | 2,0 | |
| Unemployed persons (15-64 years) | 6,5 | 6,5 | 0,0 | –0,2 | 2 611 |
| Men aged 15-64 | 6,5 | 6,4 | –0,1 | –0,6 | 1 270 |
| Women aged 15-64 | 6,6 | 6,6 | 0,0 | 0,2 | 1 341 |
| 15-24 years | 8,6 | 8,8 | 0,2 | –0,3 | 656 |
| 25-49 years | 7,5 | 7,4 | –0,1 | –0,2 | 1 510 |
| 50-64 years | 3,7 | 3,7 | 0,0 | 0,0 | 445 |
| Included : 55-64 years | 2,8 | 2,8 | 0,0 | 0,0 | 222 |
| Active people (15-64 years) | 70,3 | 70,3 | 0,0 | –0,3 | 28 173 |
| Men aged 15-64 | 74,7 | 74,7 | 0,0 | –0,4 | 14 717 |
| Women aged 15-64 | 66,0 | 66,1 | 0,1 | –0,1 | 13 456 |
| 15-24 years | 38,9 | 38,6 | –0,3 | –1,1 | 2 873 |
| 25-49 years | 89,1 | 89,2 | 0,1 | –0,4 | 18 261 |
| 50-64 years | 57,7 | 57,8 | 0,1 | 0,5 | 7 039 |
| Included : 55-64 years | 42,9 | 43,1 | 0,2 | 1,1 | 3 448 |
| Active life expectancy of 55-64 years (years) | 4,2 | 4,3 | 0,1 | 0,2 | |
- *(p) = provisional results
- Covers the population of people living in households in metropolitan France, people aged 15 years or more
- (1) those data cover the people who are 15-64 years old. They are a little bit different of the data in table 1 (which covers the total population).
- Source: INSEE, Labour Force Survey
The full time equivalent employment rate was lower by 4 points than the employment rate: it stood at 59.5% on average in Q4 2010.
The activity rate of the 15-64 years was 70.3%.
Slack work at the same level than before the crisis
In Q1 2011, 4.8% of the persons employed were underemployed. Slack work decreased by 0.5 point, to 0.2%. The unwanted part-time was 4.6% of the employed (see additional indicators on the internet).
tableauTab_ssemp_nvIR – ILO underemployment
| ILO underemployment rate (%) | Variation in point | Thousands | |||
|---|---|---|---|---|---|
| 2010Q4 | 2011Q1 (p)* | Over a quarter | Over a year | 2011Q1 (p)* | |
| Total | 5,9 | 4,8 | –1,1 | –1,3 | 1 243 |
| Included : slack work | 0,7 | 0,2 | –0,5 | –0,7 | 47 |
| Women | 8,8 | 7,5 | –1,3 | –1,4 | 944 |
| Men | 3,6 | 2,1 | –1,5 | –1,5 | 299 |
- *(p) = provisional results
- Covers the population of people living in households in metropolitan France, people aged 15 years or more
- Source : INSEE, Labour Force Survey
Revision
The ILO unemployment rate of Q4 2010 was upgraded by 0.1 point compared to the temporary publication of March 2011. In this quarter, besides the Eurostat concepts’ adoption and usual revisions, the weighting of the labour force survey was revised to include the results of the census 2008.
Pour en savoir plus
