


 25 March 2011
2011- n° 77French GDP accelerated in Q4 (+0.4% after +0.2%) and households purchasing power slowed
down (+0.3% after +0.7%) Quarterly national accounts - detailed figures - 4th Quarter 2010
25 March 2011
2011- n° 77French GDP accelerated in Q4 (+0.4% after +0.2%) and households purchasing power slowed
down (+0.3% after +0.7%) Quarterly national accounts - detailed figures - 4th Quarter 2010
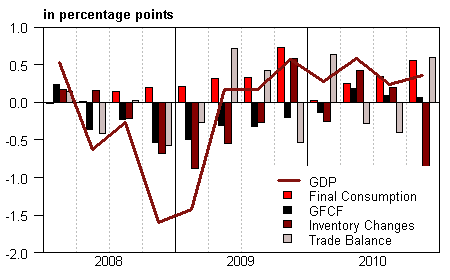
In Q4, GDP increased by 0.4% in chained volume, after +0.2% in Q3. Over the year, GDP has increased by 1.5% after the sharpest recession since World War II: -2.5% in 2009.
In Q4, GDP increased by 0.4% in chained volume, after +0.2% in Q3. Over the year, GDP has increased by 1.5% after the sharpest recession since World War II: -2.5% in 2009.
Foreign trade balance improved
Households consumption expenditure accelerated (+0.9% after +0.5%), while gross fixed capital formation (GFCF) increased less than the previous quarter (+0.3% after +0.5%). Overall, final domestic demand, stock excluded, contributed for 0.6 point to GDP growth (after +0.4 point in Q3). Over the year, households consumption accelerated (+1.7% after +0.6%), while GFCF fell anew (-1.6% after -7.0%).
In Q4, exports decelerated (+1.0% after +2.6%), while imports dropped (-1.2% after +4.0%). Hence, foreign trade balance improved and positively contributed to GDP growth (+0.6 point after -0.4 point). This contribution was overcompensated by inventory changes which contributed for -0.9 point (after +0.2 point).
Over 2010, foreign trade balance has contributed for +0.4 point to GDP growth, inventory changes for +0.1 point.
GDP growth estimate slightly revised in Q4 (from +0.3% in the previous publication to +0.4%) and in Q3 (from +0.3% to +0.2%). This is mainly due to the integration of production indicator in transport and consumption indicator in health care.
* This growth rate is seasonally and trading-day adjusted; volumes are chain-linked previous-year-prices volumes.
graphiqueGraph1 – GDP and its main components
tableauTableau 1 – GOODS AND SERVICES: RESOURCES AND USES CHAIN-LINKED VOLUMES
| 2010 Q1 | 2010 Q2 | 2010 Q3 | 2010 Q4 | 2009 | 2010 | |
|---|---|---|---|---|---|---|
| GDP | 0,3 | 0,6 | 0,2 | 0,4 | -2,5 | 1,5 |
| Imports | 1,9 | 3,9 | 4,0 | -1,2 | -10,6 | 7,8 |
| Households' consumption expenditure | 0,0 | 0,3 | 0,5 | 0,9 | 0,6 | 1,7 |
| General government's consumption expenditure | 0,0 | 0,2 | 0,3 | 0,2 | 2,8 | 1,4 |
| GFCF | -0,7 | 0,9 | 0,5 | 0,3 | -7,0 | -1,6 |
| of which Non financial corporated and unincorporated enterprises | -0,6 | 1,3 | 0,4 | 0,5 | -7,9 | -1,3 |
| Households | -0,5 | 0,1 | 1,2 | 0,6 | -8,7 | -2,2 |
| General government | -1,4 | 0,9 | -0,4 | -0,8 | 0,6 | -1,0 |
| Exports | 4,8 | 3,0 | 2,6 | 1,0 | -12,2 | 10,1 |
| Contributions : | ||||||
| Internal demand excluding inventory changes | -0,1 | 0,4 | 0,4 | 0,6 | -0,5 | 1,0 |
| Inventory changes | -0,3 | 0,4 | 0,2 | -0,9 | -1,8 | 0,1 |
| Net foreign trade | 0,6 | -0,3 | -0,4 | 0,6 | -0,2 | 0,4 |
tableauTableau 2 – Sectoral accounts
| 2010 Q1 | 2010 Q2 | 2010 Q3 | 2010 Q4 | 2009 | 2010 | |
|---|---|---|---|---|---|---|
| Profit ratio of NFC* (level) | 29,9 | 29,7 | 29,8 | 29,3 | 29,8 | 29,7 |
| Household purchasing power | 0,0 | 0,5 | 0,7 | 0,3 | 1,6 | 1,2 |
- *NFC : non-financial corporations
tableauTableau 3 – Household disposable income and household account ratios
| 2010 Q1 | 2010 Q2 | 2010 Q3 | 2010 Q4 | 2009 | 2010 | |
|---|---|---|---|---|---|---|
| HDI | 0,5 | 0,8 | 0,9 | 0,8 | 1,1 | 2,4 |
| Household purchasing power | 0,0 | 0,5 | 0,7 | 0,3 | 1,6 | 1,2 |
| HDI by ci* (purchasing power) | -0,2 | 0,3 | 0,5 | 0,1 | 0,8 | 0,4 |
| Adjusted HDI (purchasing power) | 0,0 | 0,5 | 0,6 | 0,3 | 1,6 | 1,3 |
| Saving rate (level) | 15,7 | 15,9 | 16,1 | 15,6 | 16,2 | 15,8 |
| Financial saving rate (level) | 6,8 | 6,9 | 7,0 | 6,6 | 7,0 | 6,8 |
- * ci : consumption unit
Households’ purchasing power slowed down
In Q4, wages received by households accelerated (+0.8% after +0.4%) driven by more dynamic wages per head (+0.6% after +0.2%). On the contrary, social benefits in cash slowed down (+0.2% after +0.7%) and taxes on income and wealth diminished at a lower pace than previous quarter ( -0.1% after -1,1%). Altogether, households’ disposable income (HDI) kept increasing at the same pace (+0.8% after +0.9%). In the same time, consumption price accelerated (+0.5% after +0.2%), mainly because of energy prices. As a consequence, purchasing power slowed down in Q4 (+0.3% after +0.7%).
As for annual mean, HDI in nominal terms accelerated (+2.4% after +1.1%) led by wages growth (+2.1% after 0.0%). On the contrary, social benefits in cash decelerated in 2010 (+3.0% after +5.3%) and taxes upturned (+2.6% after -4.4%) because of the one-off measures of the 2009 stimulus package. Meanwhile consumption price leveled up (+1.2% after -0.6%). As a whole, households’ purchasing power dampened in 2010 (+1.2% after +1.6%). By consumption unit, in order to measure it at an individual level, it increased by 0.4% (after 0.8%).
In Q4, nominal consumption expenditures in nominal terms increased more sharply than income. As a whole saving rate decreased by 0.5 point at 15.6%. In 2010, it diminished by 0.4 point and reached 15.8%.
Non financial corporation margin rate decreased
The increase in commodity prices caused a sharp deceleration of non financial corporation (NFC) value added (+0.2% after +0.9%). In the same time, wages paid accelerated (+0.9% after +0.7%): wage per employee was more dynamic (+0.8% after +0.3%) and employment growth was steady (+0.2%). As a consequence, NFC margin rate decreased by 0.5 point at 29.3% at end of 2010.
In 2010, margin rate was 29.7% after 29.8% in 2009: the moderate speed up of value added (+1.3%) and the slump of taxes (-9.4%) caused by the suppression of the local business tax were offset by wages dynamism (+2.6%).
Pour en savoir plus
