


 22 April 2011
2011- n° 103In April 2011, the business climate improves markedly in services Monthly survey of services - April 2011
22 April 2011
2011- n° 103In April 2011, the business climate improves markedly in services Monthly survey of services - April 2011
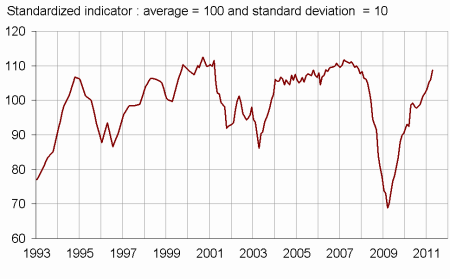
According to the business leaders surveyed in April 2011, the economic situation in services improves markedly. The business climate synthetic indicator rises by three points compared with March, and is 109. The turning point indicator stays in the favourable area.
According to the business leaders surveyed in April 2011, the economic situation in services improves markedly. The business climate synthetic indicator rises by three points compared with March, and is 109. The turning point indicator stays in the favourable area.
Business leaders consider that their activity slowed slightly in the last few months, but remained sustained. It should accelerate once again in the months to come, given their expectations.
Entrepreneurs indicate that their operating balance result picked up during the last few months, and they consider that it should continue to accelerate in the following months. They consider that their cash position becomes more comfortable, and they intend to increase their investments.
As for the general outlook, it remains almost unchanged compared with the March survey.
More job creations
In services except temporary employment agencies, business leaders consider that the number of job creations has risen notably since the beginning of the year. Job creations should be a little less numerous in the months to come given their recruitment expectations.
graphiqueGraph1 – Business climate synthetic indicator
graphiquegraph_retourn – Turning point indicator
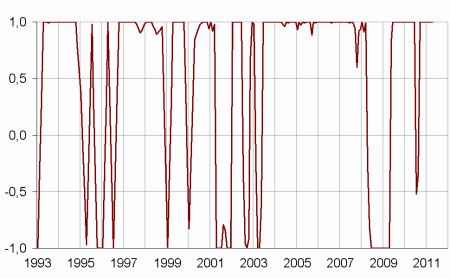
- Note: close to 1 (respectively -1), this indicator indicates a favourable short-term economic situation (respectively unfavourable).
tableauTable_quarter – Economic outlook in the services sector
| Average* | Jan.11 | Feb.11 | Mar.11 | Apr.11 | |
|---|---|---|---|---|---|
| Business climate synthetic indicator | 100 | 103 | 105 | 106 | 109 |
| General outlook | –5 | 1 | 2 | 1 | 2 |
| Past activity | 4 | 11 | 13 | 13 | 10 |
| Expected activity | 4 | 4 | 8 | 12 | 13 |
| Expected demand | 2 | 9 | 11 | 14 | 11 |
| Business situation | 1 | 4 | 5 | 5 | 7 |
| Past selling prices | –2 | –5 | –3 | 0 | 2 |
| Expected selling prices | –1 | 1 | 5 | 6 | 4 |
| Past employment | 3 | 6 | 14 | 12 | 16 |
| except temporary work agencies | 1 | 0 | 4 | 6 | 8 |
| Expected employment | 3 | 8 | 13 | 10 | 10 |
| except temporary work agencies | 0 | –1 | 7 | 5 | 4 |
| Investments | |||||
| Past investments | 2 | 7 | 10 | 8 | 5 |
| Expected investments | 2 | 1 | 5 | 9 | 11 |
| Operating balance result | |||||
| Past result | –1 | 3 | 9 | ||
| Expected result | 0 | 0 | 12 | ||
| Cash position | –10 | –11 | –8 | ||
| Difficulties of supply and demand | |||||
| difficulties of supply and demand | 9 | 9 | 10 | ||
| difficulties of supply only | 23 | 23 | 24 | ||
| difficulties of demand only | 29 | 29 | 26 | ||
| Difficulties in recruitment | 31 | 20 | 20 |
- * Average of the balances of opinion since 1988
- Source: Insee
Documentation
Methodology (2016) (pdf,158 Ko)
Pour en savoir plus
Time series : Economic outlook surveys – Services
