


 13 May 2011
2011- n° 122In 2011 Q1, French GDP sharply accelerated Quarterly national accounts - second estimate - 1st Quarter 2011
13 May 2011
2011- n° 122In 2011 Q1, French GDP sharply accelerated Quarterly national accounts - second estimate - 1st Quarter 2011
In 2011 Q1*, French GDP increased by 1.0% in volume** after +0.3% in the previous quarter. This is the steepest increase since 2006 Q2.
In 2011 Q1*, French GDP increased by 1.0% in volume** after +0.3% in the previous quarter. This is the steepest increase since 2006 Q2.
In the first quarter, manufacturing production soared (+3.7%, strongest growth for at least thirty years, after +0.7%), and services’ production accelerated (+1.1% after +0.2%), both contributing to activity’s bounce.
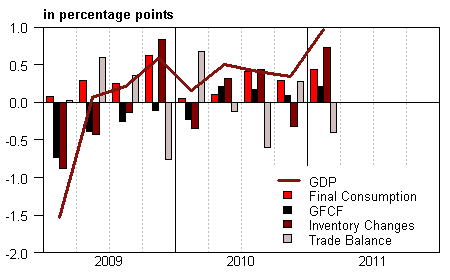
Households’ consumption expenditure slightly accelerated (+0.6% after +0.4%), while gross fixed capital formation (GFCF) did so more markedly (+1.1% after +0.5%). Overall, total domestic demand (excluding inventory changes) drove GDP on for 0.6 point of growth after 0.4 point in the previous quarter.
Imports renewed with growth this quarter (+2.7% after –0.7%) and grew more rapidly than exports (+1.4% after +0.3%). So much so that foreign trade balance weights on GDP growth: –0.4 point after +0.3 point. This is overcompensated by changes in inventories, contributing for +0.7 point to GDP growth after –0.3 point.
*Quarterly and annual national accounts published today switched to 2005 as the reference year. Quarterly accounts are available since 1980, time series since 1949 will be published on June 29th.
** This growth rate is seasonally and trading-day adjusted; volumes are chain-linked previous-year-prices volumes
graphiqueGraph1 – GDP and its main components
tableauTab1 – GOODS AND SERVICES: RESOURCES AND USES CHAIN-LINKED VOLUMES
| 2010 Q2 | 2010 Q3 | 2010 Q4 | 2011 Q1 | 2010 | 2011 (ovhg) | |
|---|---|---|---|---|---|---|
| GDP | 0.5 | 0.4 | 0.3 | 1.0 | 1.4 | 1.6 |
| Imports | 3.4 | 4.1 | -0.7 | 2.7 | 8.3 | 5.1 |
| Households' consumption expenditure | 0.1 | 0.6 | 0.4 | 0.6 | 1.3 | 1.3 |
| General government's consumption expenditure | 0.2 | 0.2 | 0.1 | 0.3 | 1.2 | 0.6 |
| GFCF | 1.1 | 0.9 | 0.5 | 1.1 | -1.4 | 2.2 |
| of which Non financial corporated and unincorporated enterprises | 2.7 | 1.3 | 0.9 | 1.9 | 2.0 | 3.9 |
| Households | 0.1 | 1.9 | 0.8 | -0.3 | -1.4 | 1.3 |
| General government | -1.9 | -1.9 | -1.4 | 1.0 | -9.7 | -1.5 |
| Exports | 3.1 | 2.0 | 0.3 | 1.4 | 9.4 | 3.4 |
| Contributions : | ||||||
| Internal demand excluding inventory changes | 0.3 | 0.6 | 0.4 | 0.6 | 0.8 | 1.3 |
| Inventory changes | 0.3 | 0.4 | -0.3 | 0.7 | 0.5 | 0.8 |
| Net foreign trade | -0.1 | -0.6 | 0.3 | -0.4 | 0.1 | -0.5 |
tableauTab2 – Sectoral accounts
| 2010 Q2 | 2010 Q3 | 2010 Q4 | 2011 Q1 | 2010 | |
|---|---|---|---|---|---|
| Profit ratio of NFC* (level) | 30.1 | 30.3 | 30.0 | 30.1 | |
| Household purchasing power | 0.2 | 0.6 | 0.4 | 0.8 |
- *NFC : non-financial corporations
tableauTab5 – Household disposable income and household account ratios
| 2010 Q2 | 2010 Q3 | 2010 Q4 | 2011 Q1 | 2010 | |
|---|---|---|---|---|---|
| HDI | 0.5 | 0.8 | 0.9 | 2.0 | |
| Household purchasing power | 0.2 | 0.6 | 0.4 | 0.8 | |
| HDI by ci* (purchasing power) | 0.0 | 0.4 | 0.2 | 0.1 | |
| Adjusted HDI (purchasing power) | 0.2 | 0.5 | 0.4 | 0.8 | |
| Saving rate (level) | 16.1 | 16.1 | 16.1 | 16.0 | |
| Financial saving rate (level) | 7.1 | 7.0 | 6.9 | 7.0 |
- * ci : consumption unit
Pour en savoir plus
Time series : Operations on goods and services
Time series : Gross domestic product balance
Time series : Institutional sector accounts
Time series : Branch accounts
