


 22 July 2011
2011- n° 185In July 2011, the business climate in services is deteriorating Monthly survey of services - July 2011
22 July 2011
2011- n° 185In July 2011, the business climate in services is deteriorating Monthly survey of services - July 2011
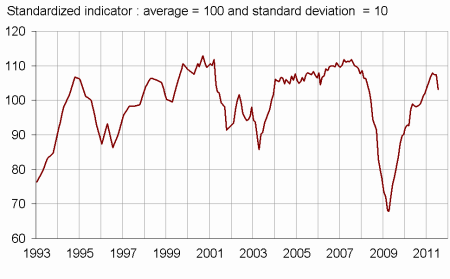
According to the business leaders surveyed in July 2011, the economic situation in services is deteriorat-ing. The business climate synthetic indicator drops by four points compared with June, and is 103.

Warning : seasonal coefficients were updated for this survey.
According to the business leaders surveyed in July 2011, the economic situation in services is deteriorating. The business climate synthetic indicator drops by four points compared with June, and is 103. The turning point indicator falls and now indicates an unfavourable economic situation.
Though business leaders consider that their activity continued to grow at a sustained pace during the last few months, they revise down markedly their activity expectations for the months to come. The corresponding balance of opinion drops and is now below its long-term average. They expect demand to be less favourable in the next few months.
They consider that their operating balance result accelerated slightly in the last few months, but they expect a sharp slowdown in the months to come.
As for the general outlook, it remains almost unchanged compared with the June survey.
Job creations remain numerous
In services except temporary employment agencies, business leaders consider that the number of job creations remained stable in the last few months. They consider that employment should continue to grow at the same pace in the following months.
graphiqueGraph1 – Business climate synthetic indicator
graphiquegraph_retourn – Turning point indicator
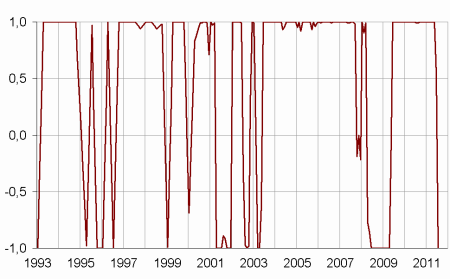
- Note: close to 1 (respectively -1), this indicator indicates a favourable short-term economic situation (respectively unfavourable).
tableauTable_quarter – Economic outlook in the services sector
| Average* | April 11 | May 11 | June 11 | July 11 | |
|---|---|---|---|---|---|
| Business climate synthetic indicator | 100 | 108 | 107 | 107 | 103 |
| General outlook | –5 | 2 | 2 | 3 | 2 |
| Past activity | 4 | 10 | 7 | 10 | 10 |
| Expected activity | 4 | 11 | 10 | 9 | 2 |
| Expected demand | 2 | 10 | 7 | 7 | 2 |
| Business situation | 1 | 6 | 6 | 4 | 6 |
| Past selling prices | –2 | 3 | 4 | 0 | 1 |
| Expected selling prices | –1 | 3 | 5 | 0 | –1 |
| Past employment | 4 | 15 | 13 | 14 | 10 |
| except temporary work agencies | 1 | 7 | 7 | 8 | 7 |
| Expected employment | 3 | 10 | 11 | 7 | 13 |
| except temporary work agencies | 1 | 4 | 6 | 6 | 6 |
| Investments | |||||
| Past investments | 2 | 7 | 8 | 7 | 7 |
| Expected investments | 2 | 9 | 9 | 8 | 7 |
| Operating balance result | |||||
| Past result | 0 | 8 | 10 | ||
| Expected result | 0 | 10 | –2 | ||
| Cash position | –10 | –8 | –7 | ||
| Difficulties of supply and demand | |||||
| difficulties of supply and demand | 9 | 10 | 10 | ||
| difficulties of supply only | 23 | 23 | 26 | ||
| difficulties of demand only | 29 | 26 | 25 | ||
| Difficulties in recruitment | 31 | 22 | 22 |
- * Average of the balances of opinion since 1988
- Source: Insee
Documentation
Methodology (2016) (pdf,158 Ko)
Pour en savoir plus
Time series : Economic outlook surveys – Services
