


 25 June 2010
2010- n° 166In Q1 2010, French GDP decelerated (+0.1% after .06%), while household purchasing
power remained slack (-0.1% after 0.0%) Quarterly national accounts - detailed figures - 1st quarter 2010
25 June 2010
2010- n° 166In Q1 2010, French GDP decelerated (+0.1% after .06%), while household purchasing
power remained slack (-0.1% after 0.0%) Quarterly national accounts - detailed figures - 1st quarter 2010
In the first quarter of 2010, French GDP increase is confirmed: +0.1% in volume*.
In the first quarter of 2010, French GDP increase is confirmed: +0.1% in volume*.
Foreign trade balance improved
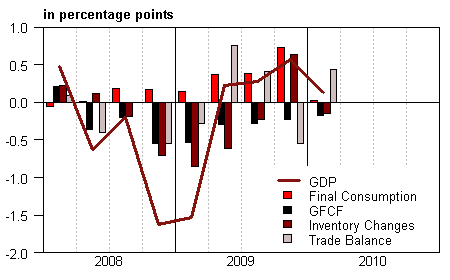
Production’s growth slightly decelerated (+0.2% after +0.7%). Total GFCF decreased again, but with a lesser magnitude than in the previous quarter (–0.9% after –1.1%) and households’ consumption’s expenditures levelled out (+0.0% after +1.0%). As a result, total domestic demand (excluding inventory changes) negatively contributed to GDP growth: –0.2 point after +0.6 point in the fourth quarter of 2009. In Q1 2010, exports bounced (+4.1% after +0.8%) whereas imports slowed (+2.1% after +2.8%). Thus, foreign trade balance improved and buoyantly contributed to GDP growth (+0.4 point after -0.6 point). Inventory changes negatively contributed to activity: –0.2 point after +0.6 point.
* This growth rate is seasonally and trading-day adjusted; volumes are chain-linked previous-year-prices volumes.
graphiqueGraph1 – GDP and its main components
Households purchasing power slightly decreased
Households disposable income in nominal terms accelerated (+0.4% after +0.2%) in Q1 2010, driven by the acceleration of wages (+0.7% after +0.5%). Social benefits in cash decelerated this quarter mainly because of the deceleration of unemployment benefits. Finally, income and wealth taxes increased this quarter, diminishing households disposable income.
Prices increased by 0.6% after 0.3%. As a whole, purchasing power slightly decreased (–0.1%) in Q1 after being stable in Q4 2009. Households expenditures in nominal terms grew faster than households disposable income. As a consequence, saving rate slightly decreased this quarter (15.7%).
The suppression of the local business tax led to a sharp increase of the profit ratio
Non financial corporations’ value added was steady this quarter whereas wages increased again (+0.4% after +0.8%). In the same time, taxes on production slumped (–24.9% after +2.2%) because of the suppression of the local business tax. As a whole, profit ratio improved by 1.2 point and reached 30.5%.
tableauTab1 – GOODS AND SERVICES: RESOURCES AND USES CHAIN-LINKED VOLUMES
| 2009 Q2 | 2009 Q3 | 2009 Q4 | 2010 Q1 | 2009 | 2010 (ovhg) | |
|---|---|---|---|---|---|---|
| GDP | 0,2 | 0,3 | 0,6 | 0,1 | -2,5 | 0,8 |
| Imports | -3,3 | 0,2 | 2,8 | 2,1 | -10,6 | 3,5 |
| Households' consumption expenditure | 0,3 | 0,3 | 1,0 | 0,0 | 0,6 | 1,0 |
| General government's consumption expenditure | 0,8 | 0,8 | 0,6 | 0,0 | 2,8 | 1,1 |
| GFCF | -1,4 | -1,3 | -1,1 | -0,9 | -7,0 | -2,7 |
| of which Non financial corporated and unincorporated enterprises | -1,5 | -1,3 | -1,2 | -1,0 | -7,9 | -2,9 |
| Households | -2,0 | -1,7 | -1,4 | -0,6 | -8,7 | -3,0 |
| General government | 1,4 | -0,5 | -0,1 | -1,5 | 0,6 | -1,5 |
| Exports | -0,6 | 1,9 | 0,8 | 4,1 | -12,2 | 5,6 |
| Contributions : | ||||||
| Internal demand excluding inventory changes | 0,1 | 0,1 | 0,5 | -0,2 | -0,5 | 0,3 |
| Inventory changes | -0,6 | -0,2 | 0,6 | -0,2 | -1,8 | 0,1 |
| Net foreign trade | 0,8 | 0,4 | -0,6 | 0,4 | -0,2 | 0,4 |
Pour en savoir plus
