


 27 August 2010
2010- n° 210The rebound in investment is confirmed for 2010: +5% according to business managers
in the manufacturing industry Industrial investment survey - July 2010
27 August 2010
2010- n° 210The rebound in investment is confirmed for 2010: +5% according to business managers
in the manufacturing industry Industrial investment survey - July 2010
Surveyed in July 2010, business managers state that investment in the manufacturing industry dropped by 21% in 2009 compared to 2008. For 2010, business managers still anticipate a rebound in investment.
Surveyed in July 2010, business managers state that investment in the manufacturing industry dropped by 21% in 2009 compared to 2008. For 2010, business managers still anticipate a rebound in investment.
graphiqueGraph1_ang – Annual nominal change in investment in the manufacturing industry
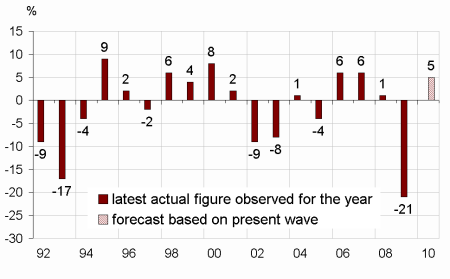
In 2010, investment would increase by 5% in the manufacturing industry
In July, business leaders in the manufacturing industry forecast a rebound of 5% in their investment for 2010 compared to 2009.
The rebound in investment would be particularly important in the sector of electrical, electronic equipment and machine equipment (+11% in 2010 after –25% in 2009). The rebound would be also marked in the sector of “other manufacturing” (+6% after –27%) such as manufacture of textiles and wearing apparel, leather and related products, manufacture of chemicals and chemical products, manufacture of chemistry, manufacture of basic pharmaceutical products and pharmaceutical
preparations, manufacture of basic metals and fabricated metal products. The invesment would also be up in the manufacture of transport equipment (+2% after –14%).
On the contrary, in the manufacture of food products and beverages, investment would go on decreasing by 3% in 2010.
tableauTab1_ang – Real annual investment growth
| NA* : (A17) and [A38] | 2009 | 2010 | ||
|---|---|---|---|---|
| observed Apr10 | observed Jul10 | Forecast Apr10 | forecast Jul10 | |
| C : MANUFACTURING INDUSTRY | –23 | –21 | 6 | 5 |
| (C1): Manufacture of food products and beverages | –14 | –10 | –5 | –3 |
| (C3): Electrical and electronic equipment; machine equipment | –25 | –25 | 5 | 11 |
| (C4): Manufacture of transport equipment | –15 | –14 | 1 | 2 |
| [CL1]: Motor vehicles | –24 | –23 | –1 | 4 |
| (C5): Other manufacturing | –28 | –27 | 6 | 6 |
- How to read this table: In manufacturing industry, firms surveyed in July observed a nominal investment decrease by 21% in 2009 comparing to 2008 and forecast an increase by 5% in 2010 comparing to 2009.
- * The codes correspond to the level of aggregation (A17) and [A38] of the "NA" aggregate classification based on NAF rev.2.
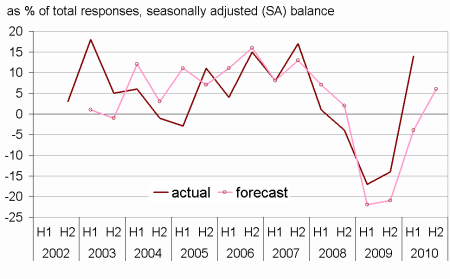
Investment would increase between H1 and H2 2010
For the first half of 2010, business leaders in manufacturing industry are stating that investment increase in H1 2010 comparatively to H2 2009, contrary to their anticipations of January. For H2 2010, they anticipate that investment would grow comparatively to H1 2010.
graphiqueGraph2_ang – Opinion of business leaders in the manufacturing industry regarding six-month change in investment (second estimation*)
tableauTabS1S2_ang – The four survey waves regarding six-month change in investment
| Survey waves | Half-year regarded | Estimation | Change |
|---|---|---|---|
| October n-1 | H2 (n-1) | first | actual |
| H1 (n) | first | forecast | |
| January n | H2 (n-1) | second | actual |
| H1 (n) | second | forecast | |
| April n | H1 (n) | first | actual |
| H2 (n) | first | forecast | |
| July n | H1 (n) | second | actual |
| H2 (n) | second | forecast |
- How to read this table: Surveyed in October of year n-1, business leaders in manufacturing industry are asked to report the change in their investment between H1 and H2 year n-1. It's the first estimation of the “actual” change concerning H2 (n-1).
Documentation
Methodology (pdf,34 Ko)
Pour en savoir plus
Time series : Industry – Investment
