


 3 June 2010
2010- n° 150Stability of the unemployment rate in Q1 2010 ILO Unemployment and Labour Market-related indicators (Labour Force Survey results)
- 1st quarter 2010
3 June 2010
2010- n° 150Stability of the unemployment rate in Q1 2010 ILO Unemployment and Labour Market-related indicators (Labour Force Survey results)
- 1st quarter 2010
The average ILO unemployment rate in Q1 2010 in metropolitan France and overseas departments stood at 9.9% of the active population.
The unemployment rate
The unemployment rate is stable in Q1 2010
The average ILO unemployment rate in Q1 2010 in metropolitan France and overseas departments stood at 9.9% of the active population.
In metropolitan France only, 9.5% of the active population was unemployed, i.e. 2.7 million people. It is stable compared to the revised figure of Q4 2009, and stays around the level of 1999.
More generally, in metropolitan France, 3.4 million people did not work but would like to work, whether they are available or not for work within two weeks, or whether they look actively for a job or not (see additional indicators on the internet).
graphiquegraph_cho_nvIR – ILO-unemployment rate
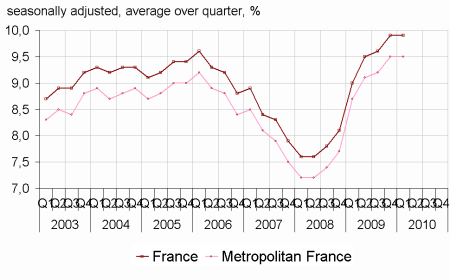
- Estimation close to +/-0.4 point of the unemployment rate
- Estimation close to +/-0.3 point of the quaterly variation of the unemployment rate
- France = Metropolitan France + overseas departments
- Covers the population of people living in households, people aged 15 years or more
- Source: INSEE, Labour Force Survey
tableautab_cho_nvIR – Ilo-unemployment rate in metropolitan France
| ILO-unemployment rate (%) | Variation in point | Thousands | |||
|---|---|---|---|---|---|
| 2009Q4 | 2010 Q1 (p)* | over quarter | over year | 2010Q1 (p)* | |
| Total | 9.5 | 9.5 | 0.0 | 0.8 | 2 703 |
| 15-24 years | 24.2 | 23.0 | –1.2 | 0.3 | 634 |
| 25-49 years | 8.6 | 8.6 | 0.0 | 0.9 | 1 579 |
| 50 years and more | 6.5 | 6.6 | 0.1 | 0.9 | 491 |
| Men | 9.4 | 9.4 | 0.0 | 1.0 | 1 404 |
| 15-24 years | 25.3 | 23.7 | –1.6 | –0.3 | 355 |
| 25-49 years | 8.2 | 8.4 | 0.2 | 1.3 | 805 |
| 50 years and more | 6.4 | 6.4 | 0.0 | 0.8 | 244 |
| Women | 9.7 | 9.6 | –0.1 | 0.7 | 1 299 |
| 15-24 years | 22.9 | 22.3 | –0.6 | 1.3 | 278 |
| 25-49 years | 9.1 | 8.9 | –0.2 | 0.4 | 774 |
| 50 years and more | 6.7 | 6.9 | 0.2 | 1.1 | 246 |
- *(p) = provisional results
- Covers the population of people living in households in metropolitan France, people aged 15 years or more
- Source: INSEE, Labour Force Survey
ILO employment and activity
The employment rate of the population aged 15-64 years increased in Q1 2010, due to the temporary contract employment: the permanent contract employment rate is still decreasing. Over Q1 2010, the employment rate of the 15-64 years stood at 63.8%: 49.3% of the 15-64 years had a permanent contract, and 6.4% had a temporary contract.
graphiquegraph_partpop_nvIR – Permanent and temporary contract employment rate(15-64 years)
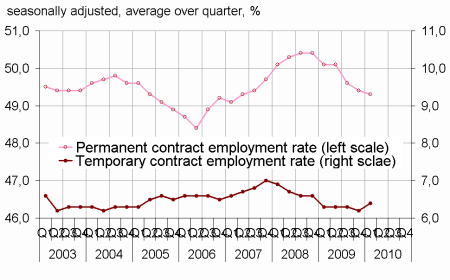
- Covers the population of people living in households, people aged 15-64 years
- Source: INSEE, Labour Force Survey
The activity rate of the 15-64 years was 70.6%.
tableautab_partpop_nvIR – ILO employment, unemployment and activity in the population aged 15-64 years
| % of people in the age group | Variation in point | Thousands (1) | |||
|---|---|---|---|---|---|
| 2009Q4 | 2010Q1 (p)* | Over quarter | Over year | 2010Q1 (p)* | |
| Employed people (15-64 years) | 63,5 | 63,8 | 0,3 | –0,6 | 25 545 |
| Full-time equivalent employment rate | 59,1 | 59,4 | 0,3 | –0,7 | 23 785 |
| Men aged 15-64 | 67,7 | 67,9 | 0,2 | –0,9 | 13 371 |
| Women aged 15-64 | 59,5 | 59,9 | 0,4 | –0,1 | 12 174 |
| 15-24 years | 27,1 | 28,2 | 1,1 | –0,4 | 2 119 |
| 25-49 years | 81,7 | 81,8 | 0,1 | –0,6 | 16 706 |
| 50-64 years | 55,2 | 55,6 | 0,4 | 0,0 | 6 720 |
| Included : 55-64 years | 41,9 | 41,8 | –0,1 | 0,0 | 3 302 |
| Core employment rate of 55-64 years | 41,2 | 41,1 | –0,1 | 0,8 | |
| Unemployed persons (15-64 years) | 6,7 | 6,7 | 0,0 | 0,6 | 2 692 |
| Men aged 15-64 | 7,1 | 7,1 | 0,0 | 0,8 | 1 397 |
| Women aged 15-64 | 6,4 | 6,4 | 0,0 | 0,5 | 1 294 |
| 15-24 years | 8,7 | 8,4 | –0,3 | 0,0 | 634 |
| 25-49 years | 7,7 | 7,7 | 0,0 | 0,8 | 1 579 |
| 50-64 years | 3,9 | 4,0 | 0,1 | 0,7 | 479 |
| Included : 55-64 years | 3,1 | 3,0 | –0,1 | 0,6 | 240 |
| Active people (15-64 years) | 70,3 | 70,6 | 0,3 | 0,1 | 28 236 |
| Men aged 15-64 | 74,8 | 75,0 | 0,2 | –0,1 | 14 768 |
| Women aged 15-64 | 65,9 | 66,2 | 0,3 | 0,3 | 13 468 |
| 15-24 years | 35,7 | 36,7 | 1,0 | –0,2 | 2 753 |
| 25-49 years | 89,4 | 89,5 | 0,1 | 0,2 | 18 285 |
| 50-64 years | 59,1 | 59,5 | 0,4 | 0,6 | 7 199 |
| Included : 55-64 years | 45,0 | 44,8 | –0,2 | 0,6 | 3 542 |
| Active life expectancy of 55-64 years (years) | 4,4 | 4,4 | 0,0 | 0,1 | |
- *(p) = provisional results
- Covers the population of people living in households in metropolitan France, people aged 15 years or more
- (1) those data cover the people who are 15-64 years old. They are a little bit different of the data in table 1 (which covers the total population).
- Source: INSEE, Labour Force Survey
Underemployment increased in Q1 2010
On Q1 2010, 6.1% of the persons employed are underemployed. The increase, +0.5 point, is pulled by the rise of the unwanted part-time, which goes from 5.0% of the employed to 5.2% in the first quarter (see additional indicators on the internet). The slack work stays at a high level.
tableauTab_ssemp_nvIR – ILO underemployment
| ILO underemployment rate (%) | Variation in point | Thousands | |||
|---|---|---|---|---|---|
| 2009 Q4 | 2010 Q1 (p)* | Over a quarter | Over a year | 2010 Q1 (p)* | |
| Total | 5.6 | 6.1 | 0.5 | 0.7 | 1 573 |
| Included : slack work | 0.7 | 0.9 | 0.2 | 0.2 | 219 |
| Women | 8.5 | 9.0 | 0.5 | 0.8 | 1 074 |
| Men | 3.1 | 3.8 | 0.7 | 0.7 | 499 |
- *(p) = provisional results
- Covers the population of people living in households in metropolitan France, people aged 15 years or more
- Source : INSEE, Labour Force Survey
Revision
The ILO unemployment rate of Q4 2009 was downgraded by 0,1 point with regard to the temporary publication. In this quarter, besides the usual revisions, the weighting of the labour force survey was revised to include the results of the census 2007.
In order to improve the precision of the data on the labor market, INSEE increases gradually the size of the sample of the Labour Force Survey since the first quarter of 2009. The operation will be ended by September 2010, when the size of the sample will have been increased by 50%. From the publication of Q3 2009 data, published results incorporate the progressive extension of the sample. An improvement in the precision of the results of the Labour Force Survey is expected, which would not lead to a significant break of series on the estimated levels.
Pour en savoir plus
