


 3 December 2009
2009- n° 314The unemployment rate is stable in Q3 2009 ILO Unemployment and Labour Market-related indicators (Labour Force Survey results)
- Third Quarter 2009
3 December 2009
2009- n° 314The unemployment rate is stable in Q3 2009 ILO Unemployment and Labour Market-related indicators (Labour Force Survey results)
- Third Quarter 2009
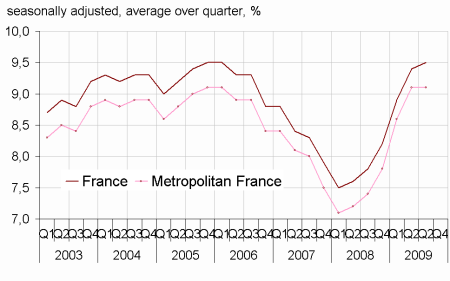
The average ILO unemployment rate for Q3 2009 in metropolitan France and overseas departments reaches 9.5% of the active population.
The unemployment rate
The unemployment rate is stable after the increase of the previous quarters
The average ILO unemployment rate for Q3 2009 in metropolitan France and overseas departments reaches 9.5% of the active population.
In metropolitan France only, 9.1% of the active population is unemployed, i.e., about 2.6 million people. It is stable compared to the revised Q2 2009. The last time this rate was reached was on the beginning of 2006, before the unemployment decreased until the beginning of 2008.
More generally, in metropolitan France, 3.3 million people do not work but would like to work, whether they are available or not for work within two weeks, or whether they look actively for a job or not (see additional indicators on the internet).
graphiquegraph_cho_nvIR – ILO-unemployment rate
- Estimation close to +/-0.4 point of the unemployment rate
- Estimation close to +/-0.3 point of the quaterly variation of the unemployment rate
- France = Metropolitan France + overseas departments
- Covers the population of people living in households, people aged 15 years or more
- Source: INSEE, Labour Force Survey
tableautab_cho_nvIR – Ilo-unemployment rate in metropolitan France
| ILO-unemployment rate (%) | Variation in points | Thousands | |||
|---|---|---|---|---|---|
| 2009Q2 | 2009Q3 (p)* | over quarter | over year | 2009Q3 (p)* | |
| Total | 9,1 | 9,1 | 0,0 | 1,7 | 2 583 |
| 15-24 years | 23,5 | 23,8 | 0,3 | 4,6 | 642 |
| 25-49 years | 8,1 | 8,2 | 0,1 | 1,6 | 1 495 |
| 50 years and more | 5,9 | 6,2 | 0,3 | 1,1 | 446 |
| Men | 8,8 | 8,8 | 0,0 | 1,9 | 1 292 |
| 15-24 years | 24,7 | 23,9 | -0,8 | 4,5 | 344 |
| 25-49 years | 7,6 | 7,5 | -0,1 | 1,8 | 713 |
| 50 years and more | 5,6 | 6,3 | 0,7 | 1,3 | 236 |
| Women | 9,3 | 9,5 | 0,2 | 1,5 | 1 291 |
| 15-24 years | 22,1 | 23,7 | 1,6 | 4,8 | 298 |
| 25-49 years | 8,7 | 8,9 | 0,2 | 1,3 | 782 |
| 50 years and more | 6,2 | 6,1 | -0,1 | 0,9 | 211 |
- *(p) = provisional results
- Covers the population of people living in households in metropolitan France, people aged 15 years or more
- Source: INSEE, Labour Force Survey
ILO employment and activity
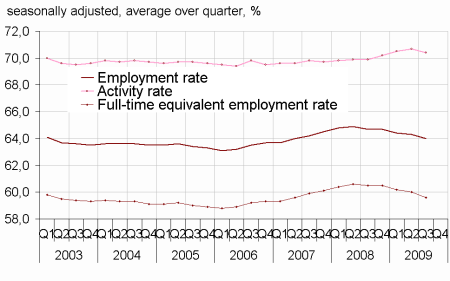
On average, the activity rate over Q3 2009 in the population aged 15-64 years is 70.4% and the employment rate 64.0%. The full time equivalent employment rate is inferior by 4 points to the employment rate: it stands at 59.6%.
graphiquegraph_partpop_nvIR – Activity rate, employment rate (15-64 years)
- Covers the population of people living in households, people aged 15-64 years
- Source: INSEE, Labour Force Survey
tableautab_partpop_nvIR – ILO employment, unemployment and activity in the population aged 15-64 years
| % of people in the age group | Variation in points | |||
|---|---|---|---|---|
| 2009Q2 | 2009Q3 (p)* | Over a quarter | Over a year | |
| Employed people aged 15-64 (= Employment rate) | 64,3 | 64,0 | -0,3 | -0,7 |
| Full-time equivalent employment rate | 60,0 | 59,6 | -0,4 | -0,9 |
| Men aged 15-64 | 68,4 | 68,0 | -0,4 | -1,3 |
| Women aged 15-64 | 60,3 | 60,1 | -0,2 | -0,2 |
| 15-24 years | 28,6 | 27,5 | -1,1 | -1,1 |
| 25-49 years | 82,2 | 82,2 | 0,0 | -1,2 |
| 50-64 years | 55,7 | 55,5 | -0,2 | 0,2 |
| Included : 55-64 years | 41,8 | 42,0 | 0,2 | 0,8 |
| Core employment rate of 55-64 years | 40,6 | 41,1 | 0,5 | 1,7 |
| Unemployed persons (proportion in the population aged 15-64) | 6,4 | 6,4 | 0,0 | 1,2 |
| Men aged 15-64 | 6,6 | 6,5 | -0,1 | 1,4 |
| Women aged 15-64 | 6,2 | 6,3 | 0,1 | 1,1 |
| 15-24 years | 8,8 | 8,6 | -0,2 | 1,8 |
| 25-49 years | 7,3 | 7,3 | 0,0 | 1,4 |
| 50-64 years | 3,5 | 3,7 | 0,2 | 0,7 |
| Included : 55-64 years | 2,8 | 2,8 | 0,0 | 0,7 |
| Active people aged 15-642 (= activity rate) | 70,7 | 70,4 | -0,3 | 0,5 |
| Men aged 15-64 | 75,1 | 74,5 | -0,6 | 0,1 |
| Women aged 15-64 | 66,5 | 66,4 | -0,1 | 0,9 |
| 15-24 years | 37,4 | 36,0 | -1,4 | 0,6 |
| 25-49 years | 89,5 | 89,5 | 0,0 | 0,2 |
| 50-64 years | 59,2 | 59,2 | 0,0 | 1,0 |
| Included : 55-64 years | 44,6 | 44,8 | 0,2 | 1,5 |
| Active life expectancy of 55-64 years | 4,3 | 4,4 | 0,1 | 0,3 |
- *(p) = provisional results
- Covers the population of people living in households in metropolitan France, people aged 15 years or more
- Source: INSEE, Labour Force Survey
Decrease of the slack work during Q3 2009
Among employed people, 5.4% are under-employed during Q3 2009 (–0.3 point), i.e 1 397 000 persons. The variations of the underemployment since the middle of the year 2008 are mainly connected to the variations of the slack work: after rising since the middle 2008, it decreases in the third quarter 2009 and stands at 143 000 persons.
tableauTab_ssemp_nvIR – ILO underemployment rate
| ILO underemployment rate (%) | Variation in points | Thousands | |||
|---|---|---|---|---|---|
| 2009Q2 | 2009Q3 (p)* | Over a quarter | Over a year | 2009Q3 (p)* | |
| Total | 5,7 | 5,4 | -0,3 | 0,7 | 1 397 |
| Included : slack work | 1,0 | 0,6 | -0,4 | 0,4 | 143 |
| Women | 8,3 | 8,3 | 0,0 | 0,4 | 1 028 |
| Men | 3,1 | 2,7 | -0,4 | 0,8 | 369 |
- *(p) = provisional results
- Covers the population of people living in households in metropolitan France, people aged 15 years or more
- Source: INSEE, Labour Force Survey
The unemployment rate in Q2 2009 in metropolitan France is not revised
The ILO unemployment rate of the second quarter 2009 in metropolitan France was not revised compared to the data published September 3, 2009. The unemployment rate in France and overseas departments is revised downward by 0.1 point.
In order to improve the precision of the data on the labor market, INSEE increases gradually the size of the sample of the Labour Force Survey since the first quarter 2009. The operation will be ended by September 2010, when the size of the sample will have been increased by 50%. From the publication of Q3 2009 data, the published results incorporate the progressive extension of the sample. An improvement in the precision of the results of the Labour Force Survey is expected, which would not lead to a significant break of series on the estimated levels.
Pour en savoir plus
