


 30 November 2009
2009- n° 309In October, noticeable increase of energetic products prices Industrial Producer and Import Price Indices - October 2009
30 November 2009
2009- n° 309In October, noticeable increase of energetic products prices Industrial Producer and Import Price Indices - October 2009
In October, the producer price indices on the French market displayed an increase of +0,8 %, after a slight decline in September (-0,3 %).
Producer price indices in industry
FRENCH MARKET: +0,8 %
In October, the producer price indices on the French market displayed an increase of +0,8 %, after a slight decline in September (-0,3 %).
The increase of energetic products prices is general
Linked with the bounce of crude petroleum prices (+6,0 %), the prices of coke and refined petroleum products stood up noticeably (+3,1 %), while electricity and gas prices progressed too, that is +5,3 % for the mining and quarrying, energy and water products.
The food industries prices decrease
The food industries prices withdrew once again in October (-0,9 % after -0,4 % in September). Prices of meat, of which beef meat notably, and prices of milk in a minor scale remained negatively oriented.
With the exception of chemical products, the prices of « other products » globally decreased
In a context of increasing petroleum prices, the prices of chemical products raised of +0,4 %. The prices of basic metals and fabricated metal products bended, due to the repercussion, sometimes delayed, of the falling prices of intermediate products and the lifelessness of the domestic demand.
FOREIGN MARKETS: +0,6 %
The French producer price indices increased also on the external markets, due to the noticeable raise of the prices of coke and refined petroleum products (+4,9 %). The prices of « other manufactured products » stood up slightly (+0,4 %).
ALL MARKETS: +0,7 %
The French producer prices on domestic and foreign markets progressed of +0,7 %. On a year, the withdraw is now compiled at -6,6 %, vs. -7,5 % in September.
Import prices indices of industrial products: +0,5 %
Strongly driven by the raise of petroleum prices, the import prices of industrial products increased globally of +0,5 %. This growth is nevertheless limited to the lone energetic products (petroleum, gas, electricity) and chemical products, the prices of the other products displaying a slight decrease.
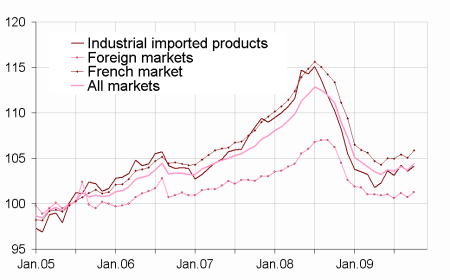
graphiqueGraphique1_EN – Total industry price indices
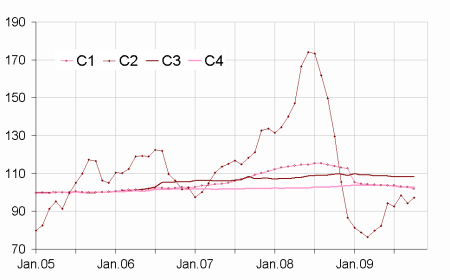
graphiqueGraphique2_EN – Producer price indices of manufactured products sold on the French market
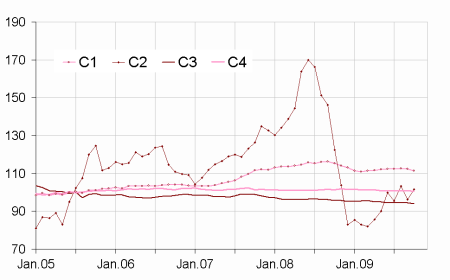
graphiqueGraphique3_EN – Import price indices of manufactured products
tableauTableau 1 – French Producer Price Indices in industry according to the market where the products are sold:
| Change in % | ||||
|---|---|---|---|---|
| Levels A 10 and A 17 in CPF rev. 2, 2008 | Weight | Oct.09 | In 1 month | In 1 year |
| French market | ||||
| BE:TOTAL INDUSTRY | 1000 | 105,9 | 0,8 | -6,6 |
| (DE) Mining and quarrying, energy, water | 130 | 118,7 | 5,3 | -4,2 |
| CZ: Manufactured prod. | 870 | 104,0 | 0,1 | -7,0 |
| (C1) Food products, beverages, tobacco | 188 | 101,8 | -0,9 | -10,6 |
| (C2) Coke and refined petroleum products | 70 | 97,3 | 3,1 | -24,8 |
| (C3) Electrical & electronic equip., computers, mach. | 92 | 108,3 | 0,1 | -1,3 |
| (C4) Transport equipment | 79 | 102,8 | 0,0 | -0,2 |
| (C5) Other man. products | 441 | 105,2 | 0,1 | -4,4 |
| Foreign markets | ||||
| BE:TOTAL INDUSTRY | 1000 | 101,3 | 0,6 | -4,6 |
| CZ: Manufactured prod. | s | 100,7 | 0,3 | -4,8 |
| (C1) Food products, beverages, tobacco | 82 | 106,6 | -0,3 | -4,8 |
| (C2) Coke and refined petroleum products | 25 | 142,5 | 5,0 | -9,8 |
| (C3) Electrical & electronic equip., computers, mach. | 202 | 96,4 | -0,1 | -1,4 |
| (C4) Transport equipment | 211 | 99,5 | -0,1 | -2,0 |
| (C5) Other man. products | s | 100,0 | 0,3 | -6,7 |
| All markets | ||||
| BE:TOTAL INDUSTRY | 1000 | 104,4 | 0,7 | -6,0 |
| CZ: Manufactured prod. | s | 102,8 | 0,1 | -6,2 |
| (C1) Food products, beverages, tobacco | 154 | 102,6 | -0,8 | -9,7 |
| (C2) Coke and refined petroleum products | 56 | 103,6 | 3,4 | -22,3 |
| (C3) Electrical & electronic equip., computers, mach. | 127 | 102,3 | 0,0 | -1,3 |
| (C4) Transport equipment | 121 | 101,0 | -0,1 | -1,2 |
| (C5) Other man. products | s | 103,5 | 0,2 | -5,1 |
tableauTableau 2 – Import prices of industrial products
| Change en % | ||||
|---|---|---|---|---|
| Levels A 10 and A 17 of nomenclature CPF rev. 2 | Weight | Oct.09 | In 1 month | In 1 year |
| BE:TOTAL INDUSTRY | 1000 | 104,1 | 0,5 | -5,5 |
| CZ: Manufactured prod. | s | 100,3 | -0,1 | -4,5 |
| (C1) Food products, beverages, tobacco | 69 | 111,4 | -0,8 | -3,4 |
| (C2) Coke and refined petroleum products | 41 | 101,7 | 5,6 | -16,9 |
| (C3) Electrical & electronic equip., computers, mach. | 210 | 94,1 | -0,4 | -1,7 |
| (C4) Transport equipment | 133 | 100,6 | -0,1 | -0,7 |
| (C5) Other manufactured products | s | 101,4 | -0,5 | -5,7 |
- r: updated ; nd: non available ; s : confidential
tableauTableau 3 – Revision of each index at total industry level
| Jul.09 / Jun.09 | Aug.09 / Jul.09 | Sep.09 / Aug.09 | |
|---|---|---|---|
| French producer prices in industry sold on the French market | // | // | // |
| French producer prices in industry sold on the foreign markets | +0,1 | +0,1 | +0,2(1) |
| French producer prices in industry sold on all markets | +0,1 | +0,1 | // |
| Import prices of industrial products | // | // | // |
- (1) Reading note: the evolution of the index between Aug.09 and Sep.09 published last month was equal to -0,6 %. It is updated to -0,4 %; that is to a say a revision of +0,2 %.
Pour en savoir plus
