


 30 October 2015
2015- n° 265Household consumption of goods was stable in September and grew by 0.7% over the
third quarter Household consumption expenditure on goods - September 2015
30 October 2015
2015- n° 265Household consumption of goods was stable in September and grew by 0.7% over the
third quarter Household consumption expenditure on goods - September 2015
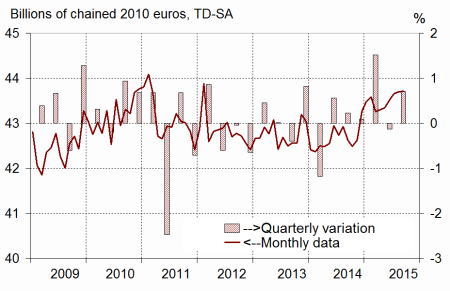
In September 2015, household consumption expenditure stagnated (after +0.1% in August, in volume*). Purchases of durable goods increased strongly (+1.4%), buoyed by car purchases (+2.3%). On the contrary, food consumption kept declining. Expenditure on energy was virtually stable (–0.1%). Over the third quarter, household consumption bouced back by 0.7% after –0.1% over the second quarter.
In September 2015, household consumption expenditure stagnated (after +0.1% in August, in volume*). Purchases of durable goods increased strongly (+1.4%), buoyed by car purchases (+2.3%). On the contrary, food consumption kept declining. Expenditure on energy was virtually stable (–0.1%). Over the third quarter, household consumption bouced back by 0.7% after –0.1% over the second quarter.
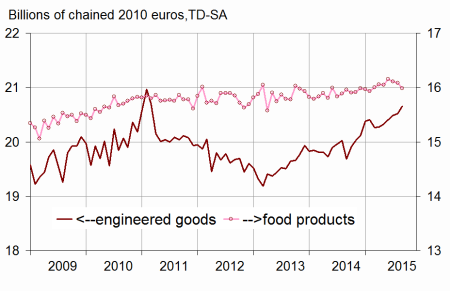
Engineered goods: on the rise
In September, consumption of engineered goods increased again (+0.7% after +0.2% in August). It gained 1.1% over the third quarter.
Durables: strong growth
In September 2015, expenditure on durable goods recorded its highest rise (+1.4%) since the beginning of the year. It was led by car purchases which accelerated (+2.3% after +0.3% in August). Consumption of jewellery also increased. However, expenditure on household durables stepped back slightly (–0.3%): the dynamism of household appliances expenditure was offset by the strong downturn of furnitures purchases. Over the third quarter, expenditure on durable goods grew by 1.0%.
Textile-clothing: decreasing over the month, growing over the quarter
In September, expenditure on textile, clothing and leather dipped (–0.4%) after a stability in August. This drop comes mainly from shoes purchases. However, over the third quarter, expenditure on clothing increased sharply (+2.0%).
[* Volumes are chained and all figures are trading days and seasonally adjusted.]
graphiquegraph1_new_ang – Total consumption of goods
graphiquegraph2_new_ang – Food and engineered goods
graphiquegraph3_new_ang – Breakdown of engineered goods
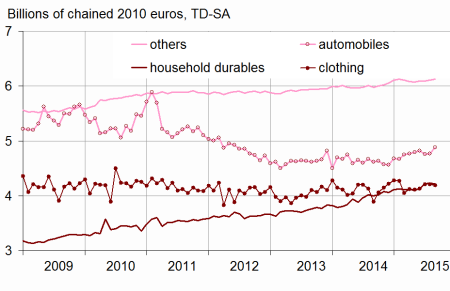
Other engineered goods: moderate increase
Expenditure on other engineered goods increased slightly in September (+0.3%). In particular, expenditure on hardware recovered, while consumption of perfume fell back sligthly. Over the third quarter, the increase of other engineered goods was also moderate (+0.4 %).
Food products: falling again
Food products consumption went down for the third consecutive month (–0.6% in September), mainly because of meat consumption. All in all, food products purchases declined sligthly over the third quarter (–0.2%).
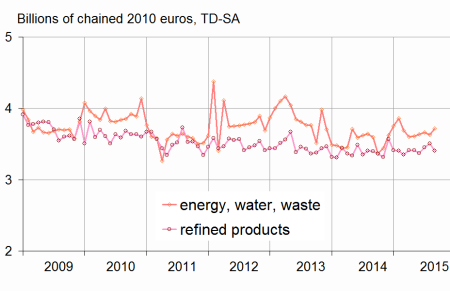
Energy: virtually stable
Energy consumption was virtually stable in September (–0.1%). Expenditure on gas and electricity increased strongly. However, domestic oil consumption dropped significantly, after a sharp increase in August. Over the whole quarter, expenditure on energy increased by 1.6%.
The variation in August 2015 is scaled up
The variation of household expenditure on goods in August 2015 is scaled up slightly: +0.1% instead of 0.0%. Indeed, since the previous publication, new information has been integrated, and the seasonal adjustment coefficients have been updated.
graphiquegraph4_new_ang – Energy
tableautab1_eng – Household consumption expenditure on goods
| Poids (1) | July | Aug. | Sept. | Sept. 15 / Sept. 14 | Q / Q-1 (2) | |
|---|---|---|---|---|---|---|
| Food products | 38 | –0,3 | –0,1 | –0,6 | 0,1 | –0,2 |
| Engineered goods | 44 | 0,4 | 0,2 | 0,7 | 4,9 | 1,1 |
| - Inc. Durables | 21 | 0,0 | 0,1 | 1,4 | 5,3 | 1,0 |
| - Automobiles | 11 | –1,4 | 0,3 | 2,3 | 5,7 | 0,2 |
| - Household durables | 7 | 2,2 | 0,3 | –0,3 | 5,6 | 2,7 |
| - Inc. Textile-clothing | 10 | 1,9 | 0,0 | –0,4 | 7,7 | 2,0 |
| - Inc. Other engineered goods | 13 | –0,1 | 0,4 | 0,3 | 2,5 | 0,4 |
| Energy | 18 | 1,5 | 0,3 | –0,1 | 2,0 | 1,6 |
| - Inc. Energy, water, waste | 10 | 0,8 | –0,8 | 2,5 | 3,5 | 1,5 |
| - Inc. Refined Products | 9 | 2,3 | 1,6 | –2,8 | 0,3 | 1,7 |
| Total | 100 | 0,3 | 0,1 | 0,0 | 2,6 | 0,7 |
| - Inc. Manufactured goods | 85 | 0,4 | 0,3 | –0,1 | 2,9 | 0,7 |
- (1) Weighting in the consumption expenditure on goods in value
- (2) Last three months / previous three months
Documentation
Methodology (pdf,23 Ko)
Pour en savoir plus
