


 30 September 2015
2015- n° 239At the end of Q2 2015, the Maastricht debt accounted for 97.6 % of GDP Debt of the general government according to the Maastricht definition - 2nd Quarter
2015
30 September 2015
2015- n° 239At the end of Q2 2015, the Maastricht debt accounted for 97.6 % of GDP Debt of the general government according to the Maastricht definition - 2nd Quarter
2015
Warnings: Quarterly debt figures are based on an accounting data source less exhaustive than the annual accounts. Results may therefore be updated during several quarters.
- The Maastricht debt increased by €16.0bn compared to the previous quarter
- The State debt increased
- Social security funds and local government debt went down
- Central agencies debt was virtually stable
- This quarter, the net public debt increased significantly more than the gross public debt
- The overall value of quoted shares and mutual fund shares decreased

Warnings: Quarterly debt figures are based on an accounting data source less exhaustive than the annual accounts. Results may therefore be updated during several quarters.
Quarterly debt variations alone are not sufficient to forecast the deficit for the current quarter. To obtain the deficit from the change in Maastricht gross public debt, net acquisitions of financial assets and other accounts receivable and payable must also be taken into consideration.
The Maastricht debt increased by €16.0bn compared to the previous quarter
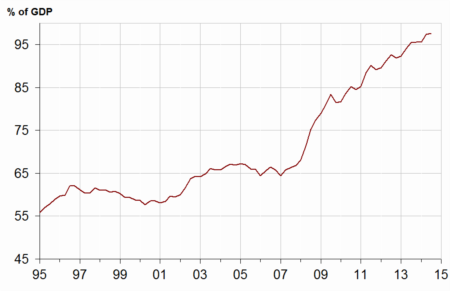
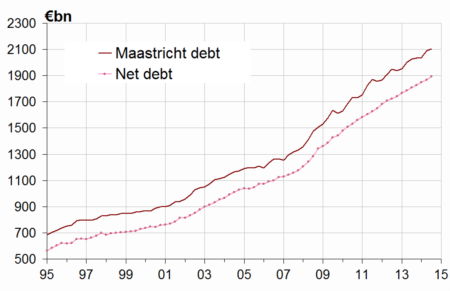
At the end of Q2 2015, the Maastricht debt reached €2,105.4bn, a €16.0bn increase in comparison to Q1 2015. It accounted for 97.6 % of GDP, 0.2 point higher than Q1 2015's level. The net public debt is more dynamic (+€26.7bn).
The State debt increased
The State contribution to the debt rose by €25.4bn in the second quarter of 2015. Long-term negotiable debt went up (+€38.7bn) as did deposits to the Treasury by its correspondents (+€2.7bn). In contrast, short-term negotiable debt went down (-€15,9bn). Finally, short and long terms loans outstanding remained stable. During Q2 2015 no loan was granted through EFSF (see “For more details” box).
Social security funds and local government debt went down
Social security funds contribution to debt fell back (-€8.1bn after +€15.8bn in Q1 2015), above all because of deleveraging from CADES (-€4.8bn), ACOSS (-€3.5bn) and CNAF (-€1.2bn). On the other hand, UNEDIC increased its short terms debt by €1.2bn.
The contribution of local government diminished slightly (-€1.2bn). Municipalities, departments and regions respectively paid off €0.6bn, €0.1bn and €0.2bn of loans. Other local government units (intercommunal syndicates and local agencies) contributed for €0.3bn to the decrease.
Central agencies debt was virtually stable
Central agencies (central government units other than the State) contribution remained virtually stable in the second quarter of 2015. A rise of €0.1bn of CEA (Commissariat à l'énergie atomique) short terms loans was compensated slightly more than by a decrease of ANR (Agence nationale de la recherche) short terms debt.
graphiqueGraphIR – General government debt under the Maastricht treaty (% of GDP) (*)
tableauTableauA – General government debt under the Maastricht treaty by sub-sector and by category
| 2014Q2 | 2014Q3 | 2014Q4 | 2015Q1 | 2015Q2 | |
|---|---|---|---|---|---|
| General Government | 2,027.6 | 2,035.4 | 2,037.8 | 2,089.4 | 2,105.4 |
| %of GDP | 95.4% | 95.6% | 95.6% | 97.4% | 97.6% |
| of which, by sub-sector : | |||||
| State | 1,614.4 | 1,609.6 | 1,610.2 | 1,647.3 | 1,672.7 |
| Central Agencies | 21.2 | 21.3 | 22.6 | 22.1 | 22.0 |
| Local Government | 179.6 | 180.2 | 188.2 | 187.4 | 186.2 |
| Social security funds | 212.4 | 224.4 | 216.8 | 232.6 | 224.5 |
| of which, by category | |||||
| Currency and deposits | 40.4 | 40.5 | 40.0 | 38.3 | 40.9 |
| Securities other than shares | 1,712.9 | 1,714.2 | 1,703.6 | 1,761.0 | 1,776.7 |
| short-term | 213.3 | 218.7 | 193.2 | 210.1 | 188.2 |
| long-term | 1,499.5 | 1,495.5 | 1,510.4 | 1,550.9 | 1,588.4 |
| Loans | 274.3 | 280.7 | 294.1 | 290.1 | 287.8 |
| short-term | 7.7 | 10.3 | 11.8 | 17.6 | 15.2 |
| long-term | 266.6 | 270.4 | 282.4 | 272.5 | 272.6 |
- (*) Explanations in the box "For more details"
- Source : National Accounts 2010 basis - Insee, DGFiP, Banque de France
This quarter, the net public debt increased significantly more than the gross public debt
At the end of Q2 2015, the net public debt reached €1,894.1bn (equivalent to 87.8 % of GDP versus to 87.1 % in Q1 2015), a €26.7bn increase compared to the previous quarter. The + €10.7bn gap between changes in net and gross debt is mainly explained by a decrease of both the State's treasury (-€7.9bn) and the social security funds' one (-€1.6bn). Furthermore, FRR (Fonds de réserve pour les retraites) sold €1.3bn of short terms negotiable debt.
tableauTableauB – General government net debt by sub-sector
| 2014Q2 | 2014Q3 | 2014Q4 | 2015Q1 | 2015Q2 | |
|---|---|---|---|---|---|
| General government | 1,806.6 | 1,828.2 | 1,850.4 | 1,867.4 | 1,894.1 |
| of which : | |||||
| The State | 1,478.9 | 1,491.3 | 1,506.3 | 1,514.1 | 1,547.8 |
| Central Agencies | 2.7 | 2.9 | 6.3 | 6.1 | 5.6 |
| Local government | 166.8 | 167.3 | 175.5 | 174.6 | 173.3 |
| Social security funds | 158.3 | 166.6 | 162.3 | 172.6 | 167.4 |
graphiqueGraph_dette_nette – Maastricht gross debt and net debt
The overall value of quoted shares and mutual fund shares decreased
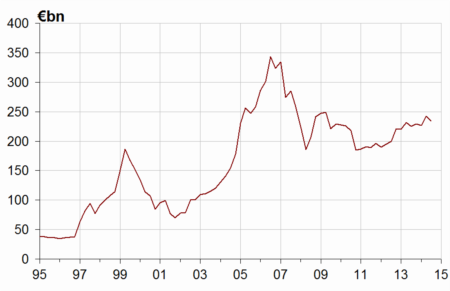
In Q2 2015, the value of quoted shares and mutual fund shares held by general government units came down to €233.8bn, a €8.5bn decrease compared to Q1 2015. The value of quoted shares went down by €7.2bn due to depreciation of some quoted shares for both the State (-€4.7bn) and the social security funds (-€1.6bn). Moreover, FRR (Fonds de réserve pour les retraites) sold €1.0bn of quoted shares. Mutual fund shares also diminished albeit to a lesser extent,(–€1.4bn) due to lowering stock markets.
tableauTableauC – General government holdings of quoted shares and mutual fund shares
| 2014Q2 | 2014Q3 | 2014Q4 | 2015Q1 | 2015Q2 | |
|---|---|---|---|---|---|
| General government | 224.9 | 229.1 | 226.5 | 242.3 | 233.8 |
| of which : | |||||
| The State | 71.2 | 74.4 | 74.5 | 74.5 | 69.8 |
| Central Agencies | 32.0 | 31.8 | 30.8 | 35.5 | 35.4 |
| Local government | 0.2 | 0.2 | 0.2 | 0.2 | 0.2 |
| Social security funds | 121.5 | 122.6 | 121.0 | 132.2 | 128.4 |
graphiqueGraph_F5 – General government holdings of quoted shares and mutual fund shares
Pour en savoir plus
