


 19 February 2015
2015- n° 34The Consumer Prices Index decreased by 1.0% in January 2015; they declined by 0.4%
year-on-year Consumer price index - final results - January 2015
19 February 2015
2015- n° 34The Consumer Prices Index decreased by 1.0% in January 2015; they declined by 0.4%
year-on-year Consumer price index - final results - January 2015
In January 2015, the Consumer Prices Index (CPI) fell by 1.0% after an increase by 0.1% in December 2014. Seasonally adjusted, it diminished by 0.3% after —0.2% in December. For the first time since 2009, the CPI declined year-on-year (—0.4%).
Monthly change: —1.0%; Year-on-year: —0.4%
In January 2015, the Consumer Prices Index (CPI) fell by 1.0% after an increase by 0.1% in December 2014. Seasonally adjusted, it diminished by 0.3% after —0.2% in December. For the first time since 2009, the CPI declined year-on-year (—0.4%).
The main contributors to the fall of the consumer Prices in January 2015, of manufactured product prices especially, were winter sales. In addition, prices of services linked to tourism went down seasonally while the decrease in petroleum product prices has continued. By contrast, food prices grew slightly due to a rebound in fresh foodstuff prices.
Manufactured product prices dropped because of winter sales
Like each year, prices of manufactured products fell in January (—3.2% in 2015; —3.0% in 2014; —1.4% year-on-year) during the winter sale period. In particular, prices of clothing and footwear plummeted (—16.5% in January 2015 after —15.4% in January 2014; —1.0% year-on-year). The winter sales also drove down prices of a large range of goods, including household textiles (—5.2%; +0.2% year-on-year), articles and products for personal care (—2.7%; +0.3% year-on-year), furnishing and furniture (—2.6%; +0.1% year-on-year) and domestic appliances (—1.4%; —2.4% year-on-year). Prices of audio-visual, photographic and information processing equipment, also subject to winter sales, continued to decline (—1.2%; —7.0% year-on-year). Moreover, medical product prices continued to decrease (—0.4%;—2.8% year-on-year). On the other hand, the prices of new cars increased in a seasonal manner in January (+2.4%; —0.2% year-on-year).
tableauOLE_LINK2 – Detailed figures for various groups
| Weights | Index | Percentage changes | |||
|---|---|---|---|---|---|
| Items | 2015 | Jan. 2015 | m-on-m | y-on-y | |
| a) All households - France | |||||
| All items (00 E) | 10000 | 126.45 | -1.0 | -0.4 | |
| All items SA (00 C) | 10000 | 127.28 | -0.3 | -0.3 | |
| Food (4000 E) | 1662 | 131.82 | 0.1 | -0.2 | |
| Fresh food (4001 E) | 211 | 141.03 | 0.9 | 1.6 | |
| Food excluding fresh products (4002 E) | 1451 | 130.51 | 0.0 | -0.5 | |
| Tobacco (4034 E) | 199 | 258.61 | 0.0 | 1.4 | |
| MANUFACTURED PRODUCTS (4003 E) | 2584 | 97.19 | -3.2 | -1.4 | |
| Clothing and footwear (4004 E) | 437 | 93.99 | -16.5 | -1.0 | |
| Medical products (4005 E) | 427 | 77.36 | -0.4 | -2.8 | |
| Other manufactured products (4006 E) | 1720 | 102.76 | -0.5 | -1.2 | |
| ENERGY (4007 E) | 815 | 167.10 | -2.1 | -7.1 | |
| Petroleum products (4008 E) | 418 | 171.41 | -6.0 | -15.9 | |
| SERVICES (4009 E) | 4740 | 136.51 | -0.1 | 1.3 | |
| Actual rentals and services for dwellings (4010 E) | 767 | 143.19 | 0.1 | 1.2 | |
| Medical services (4011 E) | 568 | 122.85 | 0.1 | 0.8 | |
| Transport and communication services (4012 E) | 510 | 95.85 | -1.4 | 0.3 | |
| Other services (4013 E) | 2895 | 147.22 | 0.1 | 1.6 | |
| ALL ITEMS EXCLUDING RENTALS AND TOBACCO (5000 E) | 9192 | 123.76 | -1.1 | -0.5 | |
| ALL ITEMS EXCLUDING TOBACCO (4018 E) | 9801 | 124.53 | -1.0 | -0.4 | |
| b) Manual or clerical worker headed urban households - France | |||||
| ALL ITEMS EXCLUDING TOBACCO (4018 D) | 9714 | 124.42 | -1.0 | -0.4 | |
| ALL ITEMS (00 D) | 10000 | 127.23 | -0.9 | -0.3 | |
| c) Households that belong to the lowest equivalized disposable income quintile - France | |||||
| ALL ITEMS EXCLUDING TOBACCO (4018 Q) | 9687 | 125.60 | -1.0 | -0.5 | |
- Source : INSEE - Consumer Price Indexes
tableauTableau1English – Detailed figures for Core inflation* and HICP**
| Items | Weights | Index | Percentage changes | |
|---|---|---|---|---|
| 2015 | Jan. 2015 | m–on–m | y–on–y | |
| All items "Core inflation" (4022 S) | 6042 | 122.41 | 0.0 | 0.2 |
| Food excluding fresh products, meat, milk and exotic products (4019 S) | 715 | 124.82 | 0.3 | -0.8 |
| Manufactured products (4020 S) | 2103 | 103.05 | -1.1 | -1.1 |
| Services including actual rentals and services for dwellings (4021 S) | 3224 | 140.38 | 0.5 | 1.3 |
| All items HICP (00 H) | 114.17 | -1.1 | -0.4 | |
- * ISJ : Core inflation indicator excludes public sector prices, the most volatile consumer prices and the tax measures. Seasonally adjusted, this index is calculated for all households in France excluding overseas departments and territories (base 100 1998).
- **HICP : Harmonised Indices of Consumer Prices are inflation figures designed for international comparison of consumer price inflation between Member states of the European Union. This index is calculated for all households in France (base 100 2005).
- Source : Insee - Consumer Price Indexes
graphiqueGraphique1English – Consumer price index (IPC) and Core inflation (ISJ) – year-on-year changes
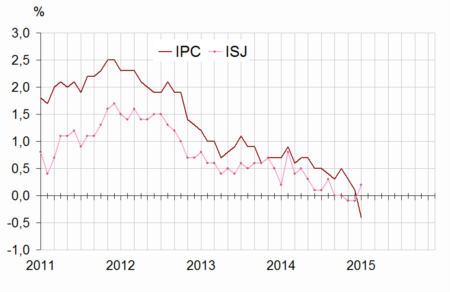
- Source : INSEE - Consumer Price Indexes
Energy prices decreased again
In January 2015, energy prices dropped for the sixth month in a row (—2.1% after —2.6% in December). Year-on-year, they fell by 7.1%. Several taxes and duties on energy products were increased in January 2015, but, for petroleum products, the ongoing fall of oil prices had more than offset those tax measures : their prices declined again (—6.0% in January; —15.9% year-on-year), more for heating fuels (—8.7%; —23.4% year-on-year) than for motor fuels (—5.7%; —15.0% year-on-year).
On the other hand, prices of town gas (+1.6%; +2.1% year-on-year) and those of electricity (+2.4%; +4.3% year-on-year) grew in January 2015, following tax increases.
Service prices declined slightly
Overall, service prices declined slightly (—0.1%; +1.3% year-on-year), seasonal increases and seasonal decreases almost counterbalanced each other. Many tariffs have been largely raised in January 2015. Postal rate increase was especillay high (+8.8%; +9.3% year-on-year). The price increase was more subdued for other services, particularly for insurance (+1.5%; +2.9% year-on-year) and toll facilities and parking meters (+1.0%; +2.1% year-on-year). Similarly, prices of passenger transport by road (+1.1%; +2.3% year-on-year), those of combined passenger transport (+2.2%; +2.6% year-on-year) and passenger transport by railways (+2.3%) increased significantly in January 2015. Conversely, after the year-end holidays, prices of services related to tourism fell seasonally: airfares by —11.7% (stable year-on-year), prices of accommodation services by —4.0% (+1.8% year-on-year) and those of package holidays by —12.9% (+3.1% year-on-year).
Slight increase in food prices
Food prices grew sligthly in January 2015 (+0.1%; —0.2% year-on-year) due to a rebound in fresh foodstuff prices (+0.9%; +1.6% year-on-year, after —0.6% in December 2014), in particular prices of fresh vegetables (+5.7%; +2.5% year-on-year after —2.9% in December 2014) and those of fresh fishes and seafood (+5.1%; +3.0% year-on-year after +1.2% in December 2014). On the other hand, prices of fresh fruits declined in a seasonal manner (—5.5%; —0.3% year-on-year). Excluding fresh products, food prices were stable in January 2015 and diminished by 0.5% year-on year (down from —0.4% in December 2014). Only prices of meat (+0.2%) and alcoholic beverages (+1.0%) grew year-on-year.
Core inflation increased slightly
The core inflation indicator (ISJ) was stable between December 2014 and January 2015. It grew slightly year-on-year (+0.2%). The Harmonized Index of Consumer Prices (HICP) dropped by 1.1% in January 2015 and decreased by 0.4% compared to Januray 2014 (after +0.1% year-on-year in December and +0.4% in November 2014).
Pour en savoir plus
