


 23 December 2015
2015- n° 324At the end of Q3 2015, the Maastricht debt accounted for 96.9 % of GDP Debt of the general government according to the Maastricht definition - 3rd Quarter
2015
23 December 2015
2015- n° 324At the end of Q3 2015, the Maastricht debt accounted for 96.9 % of GDP Debt of the general government according to the Maastricht definition - 3rd Quarter
2015
Warnings: Quarterly debt figures are based on an accounting data source less exhaustive than the annual accounts. Results may therefore be updated during several quarters.
- The Maastricht debt decreased by €2.2 billion compared to the previous quarter
- Local government debt and the State debt went down
- Social security funds debt increased marginally
- In Q3 2015, the net public debt decreased slightly less than the gross public debt
- The overall value of quoted shares and mutual fund shares decreased

Warnings: Quarterly debt figures are based on an accounting data source less exhaustive than the annual accounts. Results may therefore be updated during several quarters.
Quarterly debt variations alone are not sufficient to forecast the deficit for the current quarter. To obtain the deficit from the change in Maastricht gross public debt, net acquisitions of financial assets and other accounts receivable and payable must also be taken into consideration.
The Maastricht debt decreased by €2.2 billion compared to the previous quarter
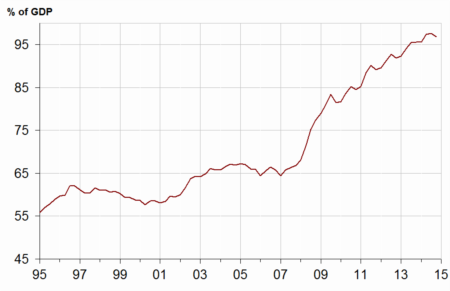
At the end of Q3 2015, the Maastricht debt reached €2,103.2 billion, a €2.2 billion decrease in comparison to Q2 2015. It accounted for 96.9 % of GDP, 0.7 points lower than Q2 2015's level. The net public debt declined more slightly (–€1.4 billion).
Local government debt and the State debt went down
In the third quarter of 2015, the contribution of local government diminished (–€1.6 billion). Municipalities, departments and regions respectively paid off €0.3 billion, €0.7 billion and €0.7 billion of loans. Other local government units (intercommunal syndicates and local agencies) contributed for +€0.1 billion.
The State contribution to the debt decreased by €1.1 billion. Short-term negotiable debt went down (–€2.0 billion). On the other hand, deposits to the Treasury by its correspondents increased slightly (+€0.7 billion). Long-term negotiable debt and short and long term loans outstanding remained stable. During Q3 2015, no loan was granted through the European Financial Stability Facility (EFSF, see “For more details” box). Moreover, the contribution of central agencies (central government units other than the State) remained stable.
Social security funds debt increased marginally
Social security funds contribution to debt went up slightly (+€0.5 billion), above all because of UNEDIC (+€1.1 billion), CNAF (+€0.9 billion) and ACOSS (+€0.8 billion). Conversely, CADES paid off €1.3 billion of short-term negotiable debt and €0.8 billion of guarantee deposits.
graphiqueGraphIR – General government debt under the Maastricht treaty (% of GDP) (*)
tableauTableauA – General government debt under the Maastricht treaty by sub-sector and by category
| 2014Q3 | 2014Q4 | 2015Q1 | 2015Q2 | 2015Q3 | |
|---|---|---|---|---|---|
| General Government | 2,035.4 | 2,037.8 | 2,089.4 | 2,105.4 | 2,103.2 |
| % of GDP | 95.6% | 95.6% | 97.4% | 97.6% | 96.9% |
| of which, by sub-sector : | |||||
| State | 1,609.6 | 1,610.2 | 1,647.3 | 1,672.7 | 1,671.6 |
| Central agencies | 21.3 | 22.6 | 22.1 | 22.0 | 22.0 |
| Local government | 180.2 | 188.2 | 187.4 | 186.2 | 184.6 |
| Social security funds | 224.4 | 216.8 | 232.6 | 224.5 | 225.0 |
| of which, by category | |||||
| Currency and deposits | 40.5 | 40.0 | 38.3 | 40.9 | 41.6 |
| Securities other than shares | 1,714.2 | 1,703.6 | 1,761.0 | 1,776.7 | 1,773.4 |
| short-term | 218.7 | 193.2 | 210.1 | 188.2 | 186.2 |
| long-term | 1,495.5 | 1,510.4 | 1,550.9 | 1,588.4 | 1,587.1 |
| Loans | 280.7 | 294.1 | 290.1 | 287.8 | 288.2 |
| short-term | 10.3 | 11.8 | 17.6 | 15.2 | 14.0 |
| long-term | 270.4 | 282.4 | 272.5 | 272.6 | 274.2 |
- (*) Explanations in the box “For more details”
- Source: National Accounts 2010 basis - Insee, DGFiP, Banque de France
In Q3 2015, the net public debt decreased slightly less than the gross public debt
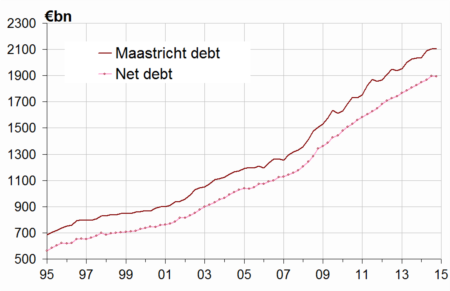
At the end of Q3 2015, the net public debt reached €1,894.3 billion (equivalent to 87.3 % of GDP versus to 87.9 % in Q2 2015), a €1.4 billion decrease compared to the previous quarter. The + €0.8 billion gap between changes in net and gross debt is mainly explained by a decrease of the State's cash position (–€3.1 billion) partially offset by the rise of the cash position of both social security funds (+ €2.0 billion) and central agencies (+ €0.2 billion). Furthermore, FRR (Fonds de réserve pour les retraites) bought €0.3 billion of debt securities to entities outside the scope of general government.
tableauTableauB – General government net debt by sub-sector
| 2014Q3 | 2014Q4 | 2015Q1 | 2015Q2 | 2015Q3 | |
|---|---|---|---|---|---|
| General government | 1,828.2 | 1,850.4 | 1,867.4 | 1,895.7 | 1,894.3 |
| of which : | |||||
| The State | 1,491.3 | 1,506.3 | 1,514.1 | 1,547.8 | 1,549.8 |
| Central agencies | 2.9 | 6.3 | 6.1 | 5.8 | 5.5 |
| Local government | 167.3 | 175.5 | 174.6 | 173.3 | 171.8 |
| Social security funds | 166.6 | 162.3 | 172.6 | 168.8 | 167.1 |
graphiqueGraph_dette_nette – Maastricht gross debt and net debt
The overall value of quoted shares and mutual fund shares decreased
In Q3 2015, the value of quoted shares and mutual fund shares held by general government units came down to €220.8 billion, a €12.5 billion decrease compared to Q2 2015. The value of quoted shares went down by €10.7 billion, notably those held by the State (–€9.2 billion) and by social security funds (–€1.5 billion). Mutual fund shares diminished by €1.8 billion due to falling stock prices.
tableauTableauC – General government holdings of quoted shares and mutual fund shares
| 2014Q3 | 2014Q4 | 2015Q1 | 2015Q2 | 2015Q3 | |
|---|---|---|---|---|---|
| General government | 229.1 | 226.3 | 242.2 | 233.3 | 220.8 |
| of which : | |||||
| The State | 74.4 | 74.5 | 74.5 | 70.9 | 61.7 |
| Central agencies | 31.8 | 30.6 | 35.2 | 34.1 | 34.1 |
| Local government | 0.2 | 0.2 | 0.2 | 0.1 | 0.1 |
| Social security funds | 122.6 | 121.0 | 132.3 | 128.2 | 124.9 |
graphiqueGraph_F5 – General government holdings of quoted shares and mutual fund shares

Pour en savoir plus
