


 17 December 2015
2015- n° 308In December 2015, the business climate has decreased slightly in services Monthly survey of services - December 2015
17 December 2015
2015- n° 308In December 2015, the business climate has decreased slightly in services Monthly survey of services - December 2015
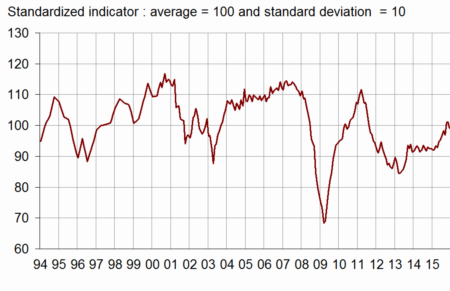
According to business managers, the business climate in services has declined in December 2015. The business climate composite indicator has decreased by two points and has fallen back (99) below its long-term average (100). The balances of opinion have decreased particularly in accomodation and food service activities, probably because of the consequences of the attacks of 13 November in Paris and Saint-Denis. The turning point indicator is on the edge of the uncertainty area.
All services
According to business managers, the business climate in services has declined in December 2015. The business climate composite indicator has decreased by two points and has fallen back (99) below its long-term average (100). The balances of opinion have decreased particularly in accomodation and food service activities, probably because of the consequences of the attacks of 13 November in Paris and Saint-Denis. The turning point indicator is on the edge of the uncertainty area.
graphiqueGraph1 – Business climate composite indicator
graphiquegraph_retourn – Turning point indicator

- Note: close to 1 (respectively -1), this indicator indicates a favourable short-term economic situation (respectively unfavourable). Between +0.3 and -0.3 : uncertainty area.
The balance of opinion on the general outlook, which relates the assessment of business leaders over their whole sector, has decreased by two points and has fallen back slightly below its long-term average.
The balance on past activity has gone down and has come back to its long-term level. Slightly more business leaders than in November report a decrease of expected activity and demand. The corresponding balances are slightly below their long-term average.
The balances on past and expected employment are virtually stable and stand clearly above their long-term average.
The balance on past investments is steady, whereas the balance on expected investments has improved. Both balances are above their long-term average.
tableauTable_quarter – Economic outlook in the services sector
| Average* | Sept. 15 | Oct. 15 | Nov. 15 | Dec. 15 | |
|---|---|---|---|---|---|
| Composite indicator | 100 | 97 | 101 | 101 | 99 |
| General outlook | –8 | –9 | –7 | –7 | –9 |
| Past activity | 2 | –3 | 4 | 4 | 2 |
| Expected activity | 2 | –3 | 1 | 1 | 0 |
| Expected demand | –1 | –5 | –2 | 1 | –2 |
| Past selling prices | –4 | –9 | –7 | –5 | –7 |
| Expected selling prices | –3 | –8 | –6 | –6 | –9 |
| Past employment | 3 | 4 | 10 | 14 | 15 |
| except temporary work agencies | 1 | 1 | 3 | 7 | 5 |
| Expected employment | 2 | 9 | 8 | 8 | 8 |
| except temporary work agencies | –1 | 1 | –1 | 3 | 4 |
| Investments | |||||
| Past investments | 1 | 4 | 8 | 7 | 7 |
| Expected investments | 1 | 1 | 2 | 4 | 8 |
- * Average of the balances of opinion since 1988
- Source: Insee, business survey in services
Road transport
In road freight, the balance on past activity has increased slightly, the balance on expected activity has improved markedly. However, more business leaders than last month expect a decrease in demand for the coming months. The balances on past and expected employment stand above their long-term average.
Accommodation and food service activities
In accommodation and food service activities, all the balances have decreased sharply. Almost all of them have come back to their level of October, after an increase in November (most responses were registered before the attacks of 13 November) and remain above their long-term average.
Information and communication
In information and communication, the balance on past activity has gone down slightly again and has deviated further from its long-term average. The balance on expected activity has recovered but remains below its long-term average. The balance on expected demand has decreased slightly, fluctuating below its long-term average. The balances on employment remain close to their long-term average.
Real estate
In real estate, the balances of opinion on past and expected activity and on expected demand have declined significantly. Only the balances on past activity and on employment stand above their long-term average.
Professional, scientific and technical activities
In professional, scientific and technical activities, the balances on activity and demand have decreased slightly. They remain close to their long-term average. The balances on employment are virtually stable, above their long-term average.
Administrative and support service activities
In administrative and support service activities, the balance of opinion on past activity has gone up whereas the balance on expected activity is stable. The balance on expected demand is virtually stable. The balances on employment remain at a very high level, particularly in temporary work agencies. All the balances stand clearly above their long-term average.
graphiquegraph_bonus_ – Expected activity in services

tableauTable_det – Detailed data
| A21 | Average* | Sept. 15 | Oct. 15 | Nov. 15 | Dec. 15 |
|---|---|---|---|---|---|
| (H) Road transport | |||||
| Past activity | –8 | –2 | –8 | –9 | –7 |
| Expected activity | –10 | –3 | –3 | –5 | 0 |
| Expected demand | –13 | –6 | –6 | –6 | –9 |
| Past employment | –8 | –6 | –4 | 3 | –2 |
| Expected employment | –11 | –9 | –4 | –2 | –3 |
| (I) Accommodation and food service activities | |||||
| Past activity | –7 | –5 | –3 | 3 | –5 |
| Expected activity | –7 | –3 | –8 | 8 | –5 |
| Expected demand | –9 | –20 | –9 | 7 | –6 |
| Past employment | –4 | 7 | 2 | 11 | 2 |
| Expected employment | –5 | 7 | –2 | –5 | –8 |
| (J) Information and communication | |||||
| Past activity | 8 | –7 | 3 | –2 | –4 |
| Expected activity | 10 | –1 | 3 | –5 | 1 |
| Expected demand | 10 | –2 | 3 | 3 | 1 |
| Past employment | 6 | –9 | 1 | 4 | 7 |
| Expected employment | 10 | 7 | 8 | 9 | 9 |
| (L) Real estate activities | |||||
| Past activity | 7 | 2 | 16 | 15 | 8 |
| Expected activity | 7 | –3 | 7 | 3 | 0 |
| Expected demand | 1 | –10 | –5 | 2 | –5 |
| Past employment | 3 | 1 | 7 | 6 | 6 |
| Expected employment | 2 | 4 | 10 | 10 | 6 |
| (M) Professional, scientific and technical activities | |||||
| Past activity | –1 | –4 | 4 | 3 | 2 |
| Expected activity | –2 | –4 | 0 | –1 | –3 |
| Expected demand | –6 | –7 | –4 | –4 | –5 |
| Past employment | 1 | 3 | 2 | 5 | 6 |
| Expected employment | 0 | 0 | –1 | 4 | 4 |
| (N) Administrative and support service activities | |||||
| Past activity | 6 | 6 | 10 | 8 | 11 |
| Expected activity | 5 | –1 | 5 | 7 | 7 |
| Expected demand | 2 | 3 | 5 | 3 | 4 |
| Past employment | 8 | 10 | 25 | 27 | 34 |
| Expected employment | 7 | 22 | 20 | 16 | 17 |
- * Average of the balances of opinion since 1988 (2006 for road transport)
Documentation
Methodology (2016) (pdf,158 Ko)
Pour en savoir plus
Time series : Economic outlook surveys – Services
