

 21 December 2018
2018- n° 349In November 2018, agricultural prices increased by +4,9% over one year Indices of agricultural prices - November 2018
21 December 2018
2018- n° 349In November 2018, agricultural prices increased by +4,9% over one year Indices of agricultural prices - November 2018
In November 2018, agricultural producer prices accelerated slightly over one year (+4.9% after +4.4% in October). Excluding fruit and vegetables, they were up by 4.1% over one year and by 0.9% over one month.
In November 2018, agricultural producer prices accelerated slightly over one year (+4.9% after +4.4% in October). Excluding fruit and vegetables, they were up by 4.1% over one year and by 0.9% over one month.
Steady cereal prices over one month
In November 2018, cereal prices were stable after two months of decline. They were still up sharply over one year (+23.6%). Soft wheat prices fell by 0.3% over one month, after +0.3% in October. Strong Russian exports allow a near-equilibrium with a dynamic demand. Grain maize prices rebounded by 2.7% over one month, after −3.4% in October. Domestic demand has supported prices despite a tough Ukrainian competition. Oilseed prices slowed down (+0.2% over one month after +1.6%).
graphiqueGraph1 – Producer prices of cereals
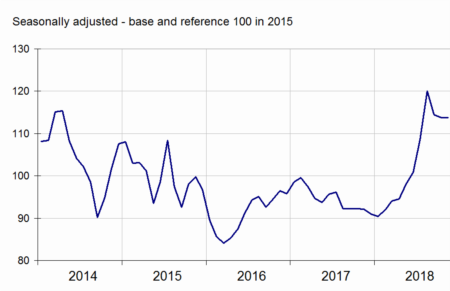
- Source: INSEE
Fresh fruit prices drop over one year, strong rise for vegetables
In November 2018, fresh fruit prices fell by 2.2% over one year. Higher prices for apples (+2.5%) did not offset the decline in seasonal nuts, chestnuts (−5.6%) and especially walnuts (−15.3%). Vegetable prices rose by 34.7% over one year with higher prices for salads (+38.6%), endives (+45.1%), carrots (+66.8%) and aromatic vegetables, garlic (+34.2%) and onion (+66.3%).
graphiqueGraph2 – Producer prices of fresh vegetables
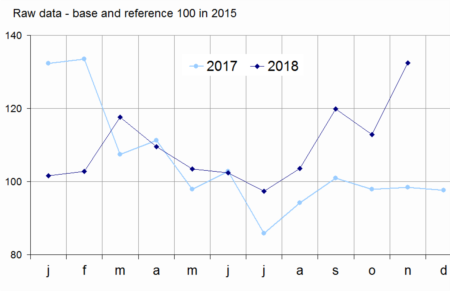
- Source: SSP (ministry in charge of agriculture)
Stable animal prices over a month
In November 2018, animal prices were stable after two months of increase (+0.6% in October after +1.3% in September). Prices of cattle fell by 1.9% over one month due to an intensification of the dairy cow cull linked to livestock feed shortage caused by the drought. Pigs prices were up by 3.9% over one month after +3.6% in October. Over one year, they were still slightly down (−0.8% after −2.2%).
graphiqueGraph3 – Producer prices of pigs and large cattle
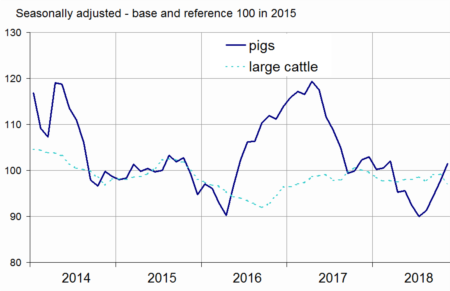
- Source: INSEE
Egg prices down over one year, rebound for milk
In November 2018, egg prices declined by 32.8% over one year. By the end of 2017, French production was in high demand because of the fipronil crisis. Cow's milk prices rose by 1.0% over one year in October 2018 after −0.6% in September.
tableautable1 – Index of producer prices of agricultural products (IPPAP)
| Variation as % over | |||||
|---|---|---|---|---|---|
| Weights | Nov. 2018 | a month | 3 months | a year | |
| Agricultural goods output | 1000 | 109.8 | /// | /// | +4.9 |
| excluding fruits and vegetables | 906 | 109.1 | +0.9 | +2.6 | +4.1 |
| Crop output (excluding fruits and vegetables) | 489 | 113.3 | +1.2 | +1.3 | +10.3 |
| Cereals | 152 | 113.8 | 0.0 | –5.2 | +23.6 |
| of which soft wheat | 90 | 116.6 | –0.3 | –5.2 | +27.0 |
| grain maize | 27 | 111.2 | +2.7 | –4.2 | +15.8 |
| Potatoes | 29 | 188.0 | /// | /// | +59.2 |
| Wines | 200 | 108.8 | +1.7 | –0.7 | –0.1 |
| PDO wines | 112 | 115.8 | +1.0 | –3.3 | –1.1 |
| other wines | 25 | 98.0 | +9.7 | +12.3 | +5.2 |
| Oleaginous | 40 | 95.1 | +0.2 | –0.6 | –0.9 |
| Horticultural products | 35 | 105.9 | +3.1 | +5.5 | +0.6 |
| Other crop products | 33 | 103.4 | 0.0 | 0.0 | –2.9 |
| Fruits and vegetables (1) | 94 | 117.6 | /// | /// | +13.7 |
| Fresh vegetables | 45 | 132.5 | /// | /// | +34.7 |
| Fresh fruits | 32 | 109.6 | /// | /// | –2.2 |
| Animal output | 417 | 104.1 | +0.6 | +4.2 | –3.0 |
| Animals | 255 | 98.9 | 0.0 | +2.0 | –1.4 |
| of which large cattle | 112 | 97.1 | –1.9 | –0.6 | –3.0 |
| calves | 20 | 98.6 | –1.4 | –3.0 | –3.0 |
| pigs | 49 | 101.5 | +3.9 | +11.2 | –0.8 |
| sheep | 14 | 97.1 | –0.1 | –2.1 | –2.7 |
| poultry | 57 | 99.9 | +1.1 | +2.6 | +1.6 |
| of which chicken | 39 | 99.8 | +0.9 | +2.6 | +1.5 |
| Milk | 146 | 109.7 | /// | +2.6 | +0.7 |
| of which cow milk (2) | 135 | 110.3 | /// | +2.8 | +0.7 |
| Eggs | 16 | 136.0 | +12.7 | +63.3 | –32.8 |
- /// Absence of meaning due to the nature of these series
- (1) Including vegetables for industry.
- (2) The October value of cow milk price index is the estimate of the November one. The previous month variation is the one commented in the text: +1,0 % over one year in October 2018.
- Sources: INSEE, SSP (ministry in charge of agriculture)
Purchase prices of means of production almost unchanged over one month
After four consecutive months of growth, intermediate consumption prices decreased slightly in November 2018 (−0.3% over one month). Falling energy prices (−4.5%), especially those of oil products, more than offset increases in fertilizer and amendment prices (+2.0%) and animal feed (+0.6%). Over one year, intermediate consumption prices slowed down a little (+5.7% after +6.4%).
Prices for capital goods increased by 0.5% over one month and by 3.8% over one year.
Revision
The variation over one year of IPPAP has been rosen by 0.2 points in October to +4.4%; The one of IPAMPA has not changed.
graphiqueGraph4 – Purchase prices of the means of agricultural production
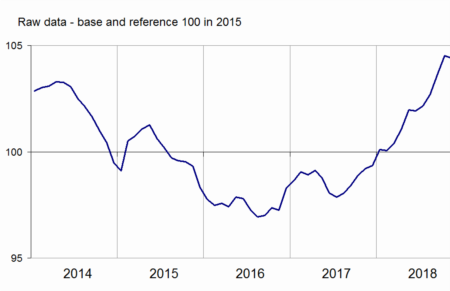
- Sources: INSEE, SSP (ministry in charge of agriculture)
tableautable2 – Indices of purchase prices of the means of agricultural production (IPAMPA)
| Variation as % over | |||||
|---|---|---|---|---|---|
| Weights | Nov. 2018 | a month | 3 months | a year | |
| Total input | 1000 | 104.4 | –0.1 | +1.7 | +5.2 |
| Intermediate consumptions | 760 | 103.3 | –0.3 | +1.9 | +5.7 |
| Energy | 93 | 120.1 | –4.5 | +1.2 | +11.8 |
| Seeds | 56 | 97.9 | +0.2 | +0.2 | +1.2 |
| Fertilisers and soil improvers | 107 | 96.1 | +2.0 | +6.8 | +11.4 |
| Plant protection products | 84 | 98.6 | –0.8 | –0.7 | +0.1 |
| Animal feed | 214 | 101.4 | +0.6 | +3.2 | +7.4 |
| Veterinary expenses | 37 | 107.8 | +0.2 | +0.8 | +2.2 |
| Small equipment and tools | 11 | 103.6 | +0.3 | +1.9 | +3.9 |
| Maintenance of materials | 88 | 105.3 | 0.0 | +0.3 | +2.6 |
| Maintenance of buildings | 9 | 105.4 | 0.0 | –0.1 | +2.1 |
| Other goods and services | 61 | 102.5 | 0.0 | –0.1 | +0.6 |
| Goods and services contributing to investment | 240 | 107.9 | +0.5 | +0.9 | +3.8 |
| Material | 168 | 107.8 | +0.7 | +1.4 | +3.9 |
| Tractors | 71 | 112.4 | +1.1 | +2.2 | +5.4 |
| Machinery and equipment for cultivation | 33 | 105.3 | +0.4 | +0.3 | +2.1 |
| Machinery and equipment for harvesting | 38 | 105.5 | +0.8 | +1.6 | +3.1 |
| Utility vehicles | 16 | 100.4 | +0.2 | +0.1 | +0.9 |
| Buildings | 72 | 108.3 | 0.0 | 0.0 | +4.0 |
- (1) The repayment of the domestic tax on energy product (TICPE) benefiting farmers has been applied in advance for the year 2018.
- Sources: INSEE, SSP (ministry in charge of agriculture)
Pour en savoir plus
Time series : Indices of agricultural prices