21 December 2018
2018- n° 343At the end of Q3 2018, the Maastricht debt accounted for €2,322.3 billion Debt of the general government according to the Maastricht definition - third quarter
2018
21 December 2018
2018- n° 343At the end of Q3 2018, the Maastricht debt accounted for €2,322.3 billion Debt of the general government according to the Maastricht definition - third quarter
2018
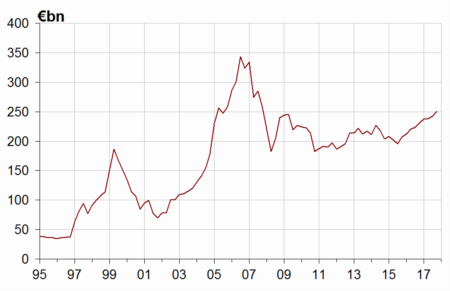
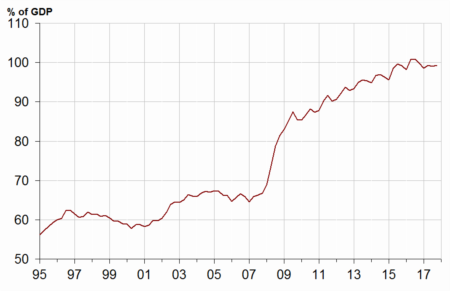
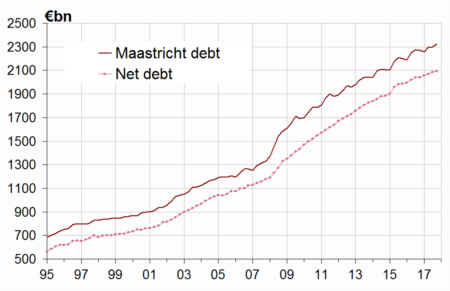
At the end of Q3 2018, the Maastricht debt reached €2,322.3 billion, a €22.5 billion increase in comparison to Q2 2018. It accounted for 99.3% of gross domestic product (GDP), 0.3 points higher than last quarter's level. By contrast, the net public debt increased moderately (€+7.7 billion).
- The Maastricht debt increased by €22.5 billion compared to the previous quarter
- The State debt went up and central agencies debt remained stable
- Local government and social security funds debts went down
- In Q3 2018, the net public debt increased by €7.7 billion
- The overall value of quoted shares and mutual fund shares held by general government increased again

Warnings: Quarterly debt figures are based on an accounting data source less exhaustive than the annual accounts. Results may therefore be updated during several quarters.
Quarterly debt variations are not equal to the estimated deficit for the current quarter. To obtain the deficit from the change in the Maastricht gross public debt, net acquisitions of financial assets and of liabilities excluded from the Maastricht debt definition must also be taken into consideration, as well as the fact that the Maastricht debt is in nominal value. Moreover, the quarterly deficit published by INSEE is seasonally and trading-day adjusted, which is not the case of the quarterly debt.
The Maastricht debt increased by €22.5 billion compared to the previous quarter
At the end of Q3 2018, the Maastricht debt reached €2,322.3 billion, a €22.5 billion increase in comparison to Q2 2018. It accounted for 99.3% of gross domestic product (GDP), 0.3 points higher than last quarter's level. By contrast, the net public debt increased moderately (€+7.7 billion).
The State debt went up and central agencies debt remained stable
In the third quarter of 2018, the State contribution to the debt increased by €32.2 billion after €19.5 billion on Q2 2018. This rise stemmed mainly from long-term negotiable debt (€+36.3 billion) and to a lesser extent from deposits at the French Treasury (€+2.3 billion). Short-term negotiable debt diminished (€ −6.5 billion).
The central agencies contribution to the debt remained stable.
Local government and social security funds debts went down
In the third quarter of 2018, the local government contribution to the debt went down moderately (by €−0.5 billion): municipalities paid off €0.3 billion, departments €0.5 billion and regions €0.1 billion. Conversely, local communities syndicates borrowed €0.1 billion and other units in local government €0.4 billion.
The contribution of social security funds to the debt went down more sharply (€−9.2 billion) above all because of ACOSS (€−7.7 billion) and to a lesser extent because of CADES (€−1.4 billion) and CNAF (€−0.1 billion).
graphiqueGraphIR – General government debt under the Maastricht treaty (% of GDP) (*)
tableauTableauA – General government debt under the Maastricht treaty by sub-sector and by category
| 2017Q3 | 2017Q4 | 2018Q1 | 2018Q2 | 2018Q3 | |
|---|---|---|---|---|---|
| General Government | 2,269.2 | 2,257.8 | 2,294.6 | 2,299.8 | 2,322.3 |
| %of GDP | 99.8% | 98.5% | 99.3% | 99.0% | 99.3% |
| of which. by sub-sector: | |||||
| State | 1,788.0 | 1,768.1 | 1,808.8 | 1,828.4 | 1,860.5 |
| Central agencies | 61.3 | 61.9 | 62.1 | 60.1 | 60.1 |
| Local Government | 196.6 | 201.5 | 200.1 | 199.4 | 199.0 |
| Social security funds | 223.3 | 226.2 | 223.6 | 211.9 | 202.7 |
| of which. by category | |||||
| Currency and deposits | 38.9 | 37.4 | 39.4 | 41.1 | 43.6 |
| Securities other than shares | 1,953.2 | 1,938.5 | 1,975.7 | 1,980.7 | 2,002.5 |
| short-term | 188.5 | 170.6 | 185.5 | 169.8 | 154.8 |
| long-term | 1,764.7 | 1,768.0 | 1,790.3 | 1,810.9 | 1,847.7 |
| Loans | 277.1 | 281.8 | 279.5 | 278.0 | 276.3 |
| short-term | 7.2 | 7.0 | 7.7 | 7.6 | 6.9 |
| long-term | 269.9 | 274.8 | 271.8 | 270.4 | 269.4 |
- (*) Explanations in the box "For more details"
- Source: National Accounts 2014 basis - Insee, DGFiP, Banque de France
In Q3 2018, the net public debt increased by €7.7 billion
At the end of the Q3 2018, the net public debt reached €2,092.7 billion (equivalent to 89.5% of GDP versus 89.7% in Q2 2018), up €7.7 billion. The €14.8 billion gap between changes in net and gross debt is mainly explained by an increase in the cash position of the State (€+11.5 billion) and social security funds (+€1.5 billion). Central agencies also increased their deposits by €1.6 billion due to provisions from the State related to BPI France as part of the Fonds pour l'innovation.
tableauTableauB – General government net debt by sub-sector
| 2017Q3 | 2017Q4 | 2018Q1 | 2018Q2 | 2018Q3 | |
|---|---|---|---|---|---|
| General government | 2,040.0 | 2,054.7 | 2,070.6 | 2,085.0 | 2,092.7 |
| of which: | |||||
| The State | 1,669.2 | 1,668.6 | 1,691.2 | 1,713.7 | 1,734.5 |
| Central agencies | 45.0 | 45.5 | 46.2 | 46.4 | 44.8 |
| Local government | 184.3 | 189.4 | 187.9 | 187.1 | 186.4 |
| Social security funds | 141.5 | 151.1 | 145.3 | 137.8 | 126.9 |
- Source: National Accounts 2014 basis - Insee, DGFiP, Banque de France
graphiqueGraph_dette_nette – Maastricht gross debt and net debt
The overall value of quoted shares and mutual fund shares held by general government increased again
In Q3 2018, the overall value of quoted shares and mutual fund shares held by general government units went up to €250.6 billion, a €8.4 billion increase compared to Q2 2018.
The quoted shares held by the State increased by €7.7 billion because of the rise in EDF's and Safran's share prices. The Fonds de réserve pour les retraites (FRR) and the Régime social des indépendants also bought both €0.3 billion of quoted shares. Conversely, the State sold €0.2 billion of Engie shares.
The value of mutual fund shares increased (€+0.3 billion) due notably to the acquisitions of the Caisse nationale d'assurance vieillesse des professions libérales for €0.4 billion. Conversely, the FRR sold off for €0.6 billion. Social security funds also increased by €0.5 billion due to highering stock markets.
tableauTableauC – General government holdings of quoted shares and mutual fund shares
| 2017Q3 | 2017Q4 | 2018Q1 | 2018Q2 | 2018Q3 | |
|---|---|---|---|---|---|
| General government | 230.6 | 237.0 | 238.3 | 242.2 | 250.6 |
| of which: | |||||
| The State | 61.1 | 64.9 | 66.7 | 58.9 | 66.4 |
| Central agencies | 36.5 | 36.3 | 36.6 | 47.0 | 47.0 |
| Local government | 0.1 | 0.1 | 0.1 | 0.1 | 0.1 |
| Social security funds | 132.9 | 135.8 | 134.9 | 136.2 | 137.2 |
- Source: National Accounts 2014 basis - Insee, DGFiP, Banque de France
graphiqueGraph_F5 – General government holdings of quoted shares and mutual fund shares