

 21 December 2018
2018- n° 338In December 2018, the business climate is stable in services Monthly survey of services - December 2018
21 December 2018
2018- n° 338In December 2018, the business climate is stable in services Monthly survey of services - December 2018
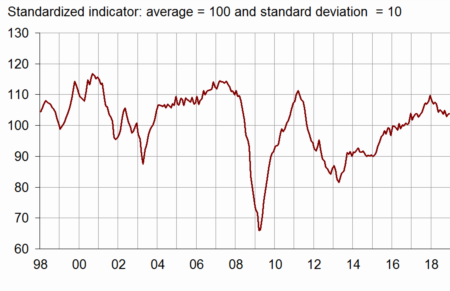
According to business managers surveyed in December 2018, the business climate in services is stable. At 104, it remains above its long-term average (100).
Otherwise, the indicator of November 2018 has been revised upward by one point because of late businesses' answers that have been taken into account.
- Own activity prospects considered on increase
- In road freight transport, the business climate is unchanged
- The business climate has plummeted in accommodation and food services
- The business climate has improved in information and communication
- The business climate has recovered in real estate activities
- In professional activities, the business climate is stable
- The climate has weakened in administrative and support service activities
According to business managers surveyed in December 2018, the business climate in services is stable. At 104, it remains above its long-term average (100).
Otherwise, the indicator of November 2018 has been revised upward by one point because of late businesses' answers that have been taken into account.
graphiqueGraph1 – Business climate composite indicator
The turning point indicator has stood in the area indicating an unfavourable short-term economic situation since October 2018.
graphiqueGraph2 – Turning point indicator
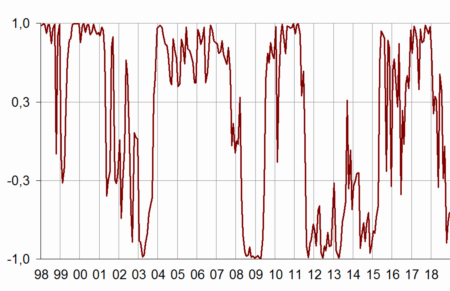
- Note: close to 1 (respectively –1), this indicator indicates a favourable short-term economic situation (respectively unfavourable). The uncertainty area is between –0.3 and +0.3.
Own activity prospects considered on increase
The balances of opinion of business managers on their expected and past activity have strengthened. In contrast, the balances on expected demand and on activity general outlook on their sector have worsened. All those balances remain above their long-term mean.
The balances on selling prices have recovered and returned above their average.
The balance on expected employment has slightly decreased but stands above its average. That on past employment remains stable, below its average.
tableauTable1_month – Economic outlook in the services sector
| Average* | Sept. 18 | Oct. 18 | Nov. 18 | Dec. 18 | |
|---|---|---|---|---|---|
| Composite indicator | 100 | 105 | 103 | 104 | 104 |
| General outlook | –7 | –1 | 0 | 0 | –4 |
| Past activity | 2 | 2 | –1 | 3 | 4 |
| Expected activity | 2 | 6 | 4 | 3 | 8 |
| Expected demand | 0 | 6 | 2 | 5 | 2 |
| Past selling prices | –4 | –3 | –7 | –8 | –3 |
| Expected selling prices | –3 | –3 | –3 | –3 | 0 |
| Past employment | 3 | 3 | –2 | –2 | –2 |
| except temporary work agencies | 1 | 3 | 3 | 0 | 0 |
| Expected employment | 3 | 6 | 4 | 6 | 5 |
| except temporary work agencies | 0 | 4 | 5 | 2 | 2 |
| Investments | |||||
| Past investments | 2 | 10 | 6 | 7 | 7 |
| Expected investments | 2 | 6 | 2 | 1 | 3 |
- * Average since 1989 for the composite indicator and since 1988 for the balances of opinion
- Source: INSEE, monthly business survey in services.
The business climate stands above its average in most sub-sectors. It stands below it in real estate activities, where it has improved nonetheless. The climate has improved also in information and communication. In contrast, it has dramatically worsened in accommodation and food service activities, and more slightly in administrative and support service activities. The climate is stable in road freight transport and in professional, scientific and technical activities.
In road freight transport, the business climate is unchanged
The business climate indicator in road freight transport is still at 107, above its average. The decrease in the balances on expected activity, on expected demand and on the general outlook is offset by the increase in the balances on employment. All balances are above their average level.
The business climate has plummeted in accommodation and food services
The business climate in accommodation and food services has lost ten points, probably affected by the “yellow vests” social movement. However, at 103, it remains above its long-term average. Most of balances have fallen, in particular that on the general outlook, on expected demand, on past activity and on past employment.
The business climate has improved in information and communication
In information and communication, the business climate has gained two points (102), above its average. This improvement is due, in particular, to the sharp increase in the balances on activity. Only the balance on expected employment has worsened. The balances on past activity, on expected demand and on expected employment stand below their average.
The business climate has recovered in real estate activities
In real estate activities, the business climate has gained five points (94) and moved closer to its average. The balances on employment, on expected activity and on the general outlook have increased whereas that on past activity and on expected demand have sharply decreased. Only the balances on employment stand above their average.
In professional activities, the business climate is stable
The business climate in professional, scientific and technical activities is unchanged (105). The increase in balances on expected activity, expected demand and past employment is offset by the decline in the balances on expected employment and on the general outlook.
The climate has weakened in administrative and support service activities
In administrative and support service activities, the climate has lost two points. However, at 106, it stands above its average. All the balances on prospects, including the general outlook, have deteriorated. However, the balance on past employment stands below its average.
tableauTable2 – Business climate composite indicator and balances of opinion by sub-sector in services
| Aggregated classification (NA 2008) at level A21 | Mean* | Sept. 18 | Oct. 18 | Nov. 18 | Dec. 18 |
|---|---|---|---|---|---|
| Road freight transport (8%) | |||||
| Composite indicator | 100 | 107 | 109 | 107 | 107 |
| Past activity | –6 | 11 | 8 | 5 | 5 |
| Expected activity | –7 | 0 | 4 | 4 | 1 |
| Expected demand | –9 | 2 | 6 | 1 | –1 |
| Past employment | –5 | –3 | 4 | 2 | 4 |
| Expected employment | –8 | 4 | 9 | 3 | 8 |
| General outlook | –19 | –4 | 0 | –3 | –9 |
| Accommodation and food service activities (11%) | |||||
| Composite indicator | 100 | 112 | 109 | 113 | 103 |
| Past activity | –7 | –8 | 2 | 12 | 3 |
| Expected activity | –7 | 1 | 1 | 2 | –1 |
| Expected demand | –9 | 7 | –1 | 6 | –4 |
| Past employment | –4 | 5 | –1 | –2 | –8 |
| Expected employment | –5 | –6 | –8 | –8 | –8 |
| General outlook | –13 | 1 | –2 | 1 | –15 |
| Information and communication (24%) | |||||
| Composite indicator | 100 | 102 | 100 | 100 | 102 |
| Past activity | 8 | 4 | –6 | –5 | 4 |
| Expected activity | 9 | 12 | 10 | 4 | 17 |
| Expected demand | 10 | 4 | –6 | 3 | 5 |
| Past employment | 6 | 2 | 8 | 8 | 11 |
| Expected employment | 11 | 17 | 17 | 13 | 7 |
| General outlook | 0 | 1 | –2 | 2 | 2 |
| Real estate activities (13%) | |||||
| Composite indicator | 100 | 89 | 89 | 89 | 94 |
| Past activity | 7 | –6 | –7 | 2 | –3 |
| Expected activity | 7 | 0 | –1 | –1 | 1 |
| Expected demand | 2 | 5 | 8 | 7 | 0 |
| Past employment | 3 | –8 | –5 | –7 | 6 |
| Expected employment | 3 | 7 | 5 | –3 | 5 |
| General outlook | –3 | –11 | –12 | –13 | –11 |
| Professional, scientific and technical activities (24%) | |||||
| Composite indicator | 100 | 107 | 107 | 105 | 105 |
| Past activity | –1 | 1 | 2 | 5 | 5 |
| Expected activity | –2 | 5 | 2 | –2 | 0 |
| Expected demand | –5 | 0 | 2 | 0 | 1 |
| Past employment | 1 | 1 | 7 | 5 | 6 |
| Expected employment | 1 | 9 | 8 | 7 | 5 |
| General outlook | –8 | –2 | 2 | –2 | –4 |
| Administrative and support service activities (18%) | |||||
| Composite indicator | 100 | 108 | 105 | 108 | 106 |
| Past activity | 6 | 9 | 3 | 5 | 11 |
| Expected activity | 5 | 15 | 12 | 18 | 16 |
| Expected demand | 3 | 15 | 11 | 13 | 8 |
| Past employment | 9 | 2 | –11 | –10 | –7 |
| Expected employment | 8 | 11 | 4 | 18 | 13 |
| General outlook | –4 | 6 | 9 | 7 | 3 |
- The figures in parentheses indicate the weights used to aggregate the sub-sector balances of opinion.
- *Composite indicator: average since 1989 (February 2006 for road transport); balances of opinion: average since 1988 (February 2006 for road transport)
- Source: INSEE, monthly business survey in services.
Documentation
Abbreviated Methodology (2017) (pdf,177 Ko)
Pour en savoir plus
Time series : Economic outlook surveys – Services