

 19 December 2018
2018- n° 328In Q3 2018, producer costs for construction increased (+0.9%) Costs of production indices in construction - third quarter 2018
19 December 2018
2018- n° 328In Q3 2018, producer costs for construction increased (+0.9%) Costs of production indices in construction - third quarter 2018
In Q3 2018, producer costs for construction increased (+0.9% as in the previous quarter). They increased in all sub-sectors, more in civil engineering (+2.2% after +1.8%) than in building construction (+0.5% after +0.7%) and than in specialised construction works (+0.7% as in Q2 2018). Over a year, these costs accelerated (+3.7% after +3.0% in Q2 2018), particularly in civil engineering (+7.3% after +4.9%) and to a lesser extent in specialised construction works (+3.1% after +2.6%) and in building construction (+3.0% after +2.6%).
In Q3 2018, producer costs for construction increased (+0.9% as in the previous quarter). They increased in all sub-sectors, more in civil engineering (+2.2% after +1.8%) than in building construction (+0.5% after +0.7%) and than in specialised construction works (+0.7% as in Q2 2018). Over a year, these costs accelerated (+3.7% after +3.0% in Q2 2018), particularly in civil engineering (+7.3% after +4.9%) and to a lesser extent in specialised construction works (+3.1% after +2.6%) and in building construction (+3.0% after +2.6%).
Materials cost continued to grow in civil engineering
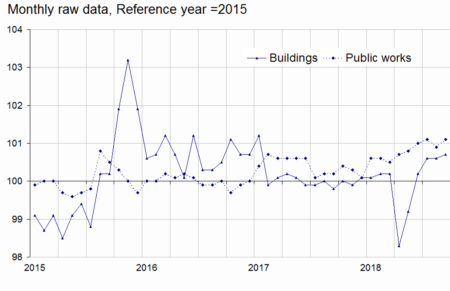
In Q3 2018, the cost of materials increased again in civil engineering: +4.6% (after +3.4%) due to the strong progression in bitumen prices. On the other hand, the cost was stable in specialised works for civil engineering (after +0.6%) and almost unchanged in building construction (−0.1% after +0.6%).
Over a year, materials cost accelerated sharply in civil engineering (+12.9% after +7.7%) and remained dynamic in building construction (+3.0% as in Q2 2018).
Energy cost rose
In Q3 2018, the cost of energy slowed down in building construction (+1.4% after +4.4%) and in public works (+1.6% after +3.5%).
Over a year, the cost accelerated again, in public works (+22.1% after +18.4%) as well as in building construction (+22.0% after +18.5%) due to an important growth in prices of gas oil.
tableauTable1 – Variations in producer cost indices for construction
| Heading | Weights (in %) | Q3 2018/ Q2 2018 | Q3 2018/ Q3 2017 |
|---|---|---|---|
| F Construction | 100.0 | +0.9 | +3.7 |
| 41.2 Construction of buildings | 10.2 | +0.5 | +3.0 |
| 42 Civil engineering | 15.9 | +2.2 | +7.3 |
| 43 Specialised construction works | 73.9 | +0.7 | +3.1 |
| 43BT Buildings | 65.2 | +0.7 | +3.0 |
| 43BTC New buildings | 24.7 | +0.5 | +3.0 |
| 43BTR Existing buildings | 40.5 | +0.8 | +3.0 |
| 43TP Specialised works for civil engineering | 8.7 | +0.5 | +3.7 |
| Buildings (41.2 + 43BT) | 75.4 | +0.6 | +2.9 |
| Public works (42 + 43TP) | 24.6 | +1.6 | +6.0 |
- Source: INSEE
tableauTable2 – Items of producer cost indices for construction
| Costs | items | Q3 2018/ Q2 2018 | Q3 2018/ Q3 2017 |
|---|---|---|---|
| Equipment | Buildings | +1.4 | +0.7 |
| Public works | +0.2 | +0.9 | |
| Labour | Labour costs in construction | +0.7 | +3.2 |
| Energy | Buildings | +1.4 | +22.0 |
| Public works | +1.6 | +22.1 | |
| Materials | Construction of buildings | -0.1 | +3.0 |
| Existing buildings | 0.0 | +2.6 | |
| Civil engineering | +4.6 | +12.9 | |
| Specialised works for civil engineering | 0.0 | +2.6 |
- Source: INSEE
graphiqueGraph1 – Production costs in construction
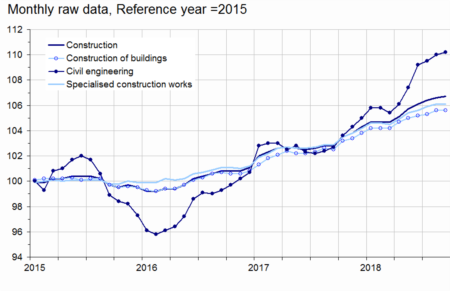
- Source: INSEE
Equipment cost increased
In Q3 2018, equipment cost rebounded in building construction (+1.4% after −0.9% in Q2 2018; +0.7% after −0.8% yoy). In public works, it slightly increased by 0.2% (after +0.3% in Q2 2018) and it accelerated over a year (+0.9% after +0.2%).
Production costs in construction were not revised in Q2 2018
In Q2 2018, the variation in producer costs in construction remained at the same rate (+0.9%).
graphiqueGraph2 – Materials cost

- Source: INSEE
graphiqueGraph3 – Equipment cost
- Source: INSEE
graphiqueGraph4 – Energy cost
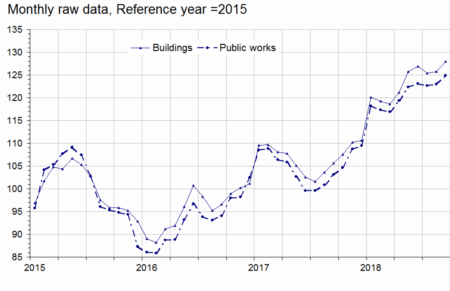
- Source: INSEE