

 24 October 2018
2018- n° 275In October 2018, the business climate is stable in services Monthly survey of services - October 2018
24 October 2018
2018- n° 275In October 2018, the business climate is stable in services Monthly survey of services - October 2018
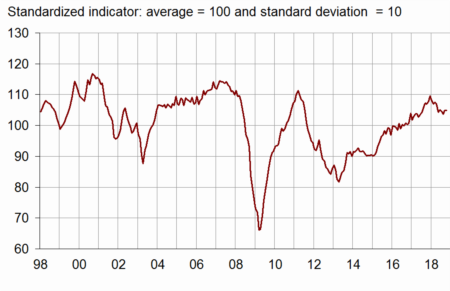
According to business managers surveyed in October 2018, the business climate is stable in services. The composite indicator which measures it stands at 105 above its long-term average (100).
- Decrease in the balances of opinion on past activity and expected demand
- In road transport, the business climate has improved again
- The business climate has weakened a little in accommodation and food service activities
- In information and communication, the business climate has dropped just below its average
- The business climate has strengthened in real estate activities
- The business climate has improved in professional, scientific and technical activities
- In administrative and support service activities, the business climate has improved again
According to business managers surveyed in October 2018, the business climate is stable in services. The composite indicator which measures it stands at 105 above its long-term average (100).
graphiqueGraph 1 – Business climate composite indicator
The turning point indicator remains in the area indicating an uncertain short-term economic situation.
graphiqueGraph 2 – Turning point indicator
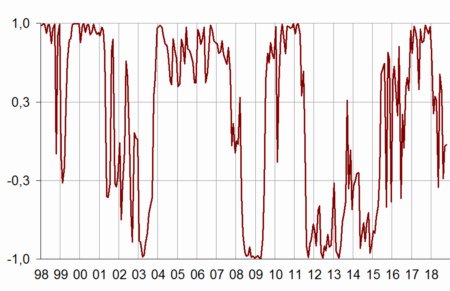
- Note: close to 1 (respectively –1), this indicator indicates a favourable short-term economic situation (respectively unfavourable). The uncertainty area is between –0.3 and +0.3.
Decrease in the balances of opinion on past activity and expected demand
The balances of opinion on past activity and on expected demand have weakened, that on past activity has even fallen below its average. The balance on expected activity has slightly increased, that on general outlook is stable. Both of them are above their average level.
The balances on past and on expected employment have slightly improved, in particular due to temporary
work agencies. They stand above their long-term average. However, the balance on difficulties in recruitment declared by the business managers has sharply increased from July to October and reached its highest level since October 2001.
The balances on investments have declined but remain above their average.
The balances on past and expected operating balance result and on cash position have deteriorated.
tableauTable 1 – Economic outlook in the services sector
| Average* | July 18 | Aug. 18 | Sept. 18 | Oct. 18 | |
|---|---|---|---|---|---|
| Composite indicator | 100 | 105 | 104 | 105 | 105 |
| General outlook | –7 | 0 | –3 | –1 | –1 |
| Past activity | 2 | 5 | 1 | 2 | 0 |
| Expected activity | 2 | 4 | 4 | 6 | 7 |
| Expected demand | 0 | 5 | 5 | 6 | 4 |
| Past selling prices | –4 | –7 | –2 | –3 | –6 |
| Expected selling prices | –3 | –5 | 0 | –3 | –2 |
| Past employment | 3 | 6 | 3 | 3 | 4 |
| except temporary work agencies | 1 | 1 | 1 | 3 | 4 |
| Expected employment | 3 | 6 | 7 | 6 | 9 |
| except temporary work agencies | 0 | 4 | 5 | 4 | 5 |
| Investments | |||||
| Past investments | 2 | 7 | 8 | 10 | 7 |
| Expected investments | 2 | 6 | 4 | 6 | 3 |
| Operating balance result | |||||
| Past result | –2 | 3 | –5 | ||
| Expected result | –2 | 0 | –1 | ||
| Cash position | –11 | –7 | –9 | ||
| Difficulties of supply and demand | |||||
| difficulties of supply and demand | 10 | 6 | 8 | ||
| difficulties of supply only | 23 | 32 | 30 | ||
| difficulties of demand only | 32 | 23 | 25 | ||
| Difficulties in recruitment | 28 | 34 | 42 |
- * Average since 1989 for the composite indicator and since 1988 for the balances of opinion
- Source: Insee, business survey in services
The business climate indicator has increased in road transport, in real estate activities, in professional, scientific and technical activities and in administrative and support service activities. It has decreased in accommodation and food services and in information-communication. It stands well above its average in transport, in accommodation and food service activities in professional activities and in administrative activities. It stands just below its average in information-communication and clearly below in real estate activities.
In road transport, the business climate has improved again
In road transport, the business climate has gained two points (109) and remains well above its average. All the balances of opinion have gone up, except that on past activity. All the balances are clearly above their long-term average.
The business climate has weakened a little in accommodation and food service activities
In accommodation and food service activities, the business climate has lost one point. However, at 111, it remains sharply above its average. The balances on expected demand, on employment and on general outlook have decreased. Conversely, the balances on past and expected activity have sharply bounced back. Except the balance on expected employment, all balances are well above their average.
In information and communication, the business climate has dropped just below its average
In information and communication, the climate has lost three points and fallen just below its average (99). This decline is due to the sharp fall in the balances on past activity, expected demand and general outlook. These balances stand below their average. In contrast, the balance on past employment has sharply grown.
The business climate has strengthened in real estate activities
In real estate activities, the business climate has improved again. However, at 91, it remains significantly below its average. The balances on expected demand and on past employment have increased. These on past and expected activity, on past employment and on general outlook stand well below their average level.
The business climate has improved in professional, scientific and technical activities
In professional, scientific and technical activities, the business climate has gained two points (109) and thus, stands well above its average level. All balances have gone up, except that on expected activity, which is stable. Otherwise, they are all above their average
In administrative and support service activities, the business climate has improved again
The climate has gained two points in administrative and support service activities. At 110, it stands clearly above its average. All balances have risen and only the balance on past employment is below its long-term average.
tableauTable 2 – Business climate composite indicator and balances of opinion by sub-sector in services
| Aggregated classification (NA 2008) at level A21 | Mean* | July 18 | Aug. 18 | Sept. 18 | Oct. 18 |
|---|---|---|---|---|---|
| Road transport (8%) | |||||
| Composite indicator | 100 | 114 | 108 | 107 | 109 |
| Past activity | –6 | 17 | 10 | 11 | 7 |
| Expected activity | –7 | 14 | 3 | 0 | 4 |
| Expected demand | –9 | 18 | 7 | 2 | 6 |
| Past employment | –5 | 8 | 5 | –3 | 3 |
| Expected employment | –8 | 5 | 2 | 4 | 6 |
| General outlook | –20 | 5 | –6 | –4 | 0 |
| Accommodation and food service activities (11%) | |||||
| Composite indicator | 100 | 113 | 112 | 112 | 111 |
| Past activity | –7 | –1 | –6 | –8 | 3 |
| Expected activity | –7 | 10 | 5 | 1 | 7 |
| Expected demand | –9 | 4 | –4 | 7 | 1 |
| Past employment | –4 | 0 | –1 | 5 | 3 |
| Expected employment | –5 | 1 | 6 | –6 | –13 |
| General outlook | –13 | –3 | 7 | 1 | –2 |
| Information and communication (24%) | |||||
| Composite indicator | 100 | 101 | 101 | 102 | 99 |
| Past activity | 8 | 10 | 8 | 4 | –9 |
| Expected activity | 9 | 7 | 5 | 12 | 12 |
| Expected demand | 10 | 4 | 4 | 4 | –5 |
| Past employment | 6 | 8 | 6 | 2 | 7 |
| Expected employment | 11 | 12 | 14 | 17 | 17 |
| General outlook | 0 | 1 | –1 | 1 | –3 |
| Real estate activities (13%) | |||||
| Composite indicator | 100 | 84 | 85 | 89 | 91 |
| Past activity | 7 | 0 | –14 | –6 | –5 |
| Expected activity | 7 | –8 | –2 | 0 | 0 |
| Expected demand | 2 | 3 | 5 | 5 | 8 |
| Past employment | 3 | –2 | –9 | –8 | –5 |
| Expected employment | 3 | –3 | 7 | 7 | 7 |
| General outlook | –3 | –16 | –15 | –11 | –12 |
| Professional, scientific and technical activities (24%) | |||||
| Composite indicator | 100 | 104 | 104 | 107 | 109 |
| Past activity | –1 | –2 | 1 | 1 | 3 |
| Expected activity | –2 | 0 | –1 | 5 | 5 |
| Expected demand | –5 | 2 | 4 | 0 | 4 |
| Past employment | 1 | 1 | –2 | 1 | 5 |
| Expected employment | 1 | 1 | 2 | 9 | 10 |
| General outlook | –8 | –3 | –4 | –2 | 2 |
| Administrative and support service activities (18%) | |||||
| Composite indicator | 100 | 108 | 107 | 108 | 110 |
| Past activity | 6 | 13 | 6 | 9 | 10 |
| Expected activity | 5 | 11 | 15 | 15 | 18 |
| Expected demand | 3 | 13 | 13 | 15 | 16 |
| Past employment | 10 | 14 | 8 | 2 | 6 |
| Expected employment | 8 | 11 | 7 | 11 | 20 |
| General outlook | –4 | 9 | 4 | 6 | 9 |
- The figures in parentheses indicate the weights used to aggregate the sub-sector balances of opinion.
- *Composite indicator: average since 1989 (February 2006 for road transport); balances of opinion: average since 1988 (February 2006 for road transport)
- Source: INSEE, monthly business survey in services.
Documentation
Abbreviated Methodology (2017) (pdf,177 Ko)
Pour en savoir plus
Time series : Economic outlook surveys – Services