

 28 September 2018
2018- n° 264In August 2018, agricultual prices increased by +3,3% over one year Indices of agricultural prices - August 2018
28 September 2018
2018- n° 264In August 2018, agricultual prices increased by +3,3% over one year Indices of agricultural prices - August 2018
In August 2018, agricultural producer prices accelerated again to +3.3% over one year (after +1.3% in July and +0.5% in June). Excluding fruit and vegetables, they went up by 3.2% over one year (after +0.5% in July) and by 1.5% over one month.
In August 2018, agricultural producer prices accelerated again to +3.3% over one year (after +1.3% in July and +0.5% in June). Excluding fruit and vegetables, they went up by 3.2% over one year (after +0.5% in July) and by 1.5% over one month.
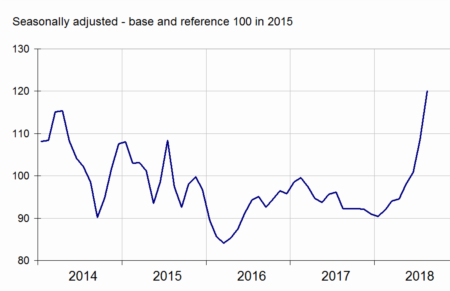
Cereal prices rose sharply
In August 2018, cereal prices gained 10.7% over one month. Drought in Europe and other cropping area like Australia raised the concern of a drop in global production. Soft wheat prices were up by 10.3% over one month and those of grain maize by 11.3%. Over one year, prices increased by 33.6% for soft wheat and 20.7% for grain maize. Rapeseed production also drew some concerns that resulted in a acceleration of their prices in August (+5.4% after +3.4% in July). Overall, oilseed prices went up by 4.1% one month after + 2.6% in July.
graphiqueGraph1 – Producer prices of cereals
- Source: INSEE
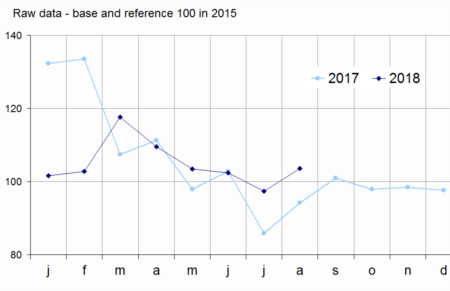
Fruits and vegetable prices up over one year
In August 2018, fruit prices rose by 14.8% over one year. Seasonal fruits prices increased sharply once again: apricots (+32.2% over one year), peaches and nectarines (+30.3%) and plums (+45.8%). Vegetable prices went up by 10.1% over one year. They were driven by higher prices for salads (+16.4% over one year), zucchini (+20.1%), and by a doubling price for cucumbers (+106.9%). On the other hand, the prices of melons (−2.3% over one year) and tomatoes (−12.0%) followed a downside.
graphiqueGraph2 – Producer prices of fresh vegetables
- Source: SSP (ministry in charge of agriculture)
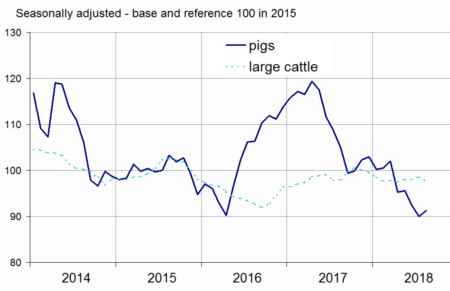
Prices down for cattle, up for pigs
In August 2018, animal prices dropped by 0.4% over one month, after being flat in July. Cattle prices faltered (−0.9% after +0.7% in July). Those of pigs rebounded (+1.4% over one month after −2.6% in July), in the wake of stronger demand at the end of the month while supply was down.
graphiqueGraph3 – Producer prices of pigs and large cattle
- Source: INSEE
Egg prices down once again
In August 2018, egg prices declined by 4.7% over one month, after −7.1% in July. The supply still exceeded a weak demand in the summer. The price of cow's milk was slightly increasing over one year (+0.2% in July after +1.1% in June).
tableautable1 – Index of producer prices of agricultural products (IPPAP)
| Variation as % over | |||||
|---|---|---|---|---|---|
| Weights | August 2018 | a month | 3 months | a year | |
| Agricultural goods output | 1000 | 106.3 | /// | /// | +3.3 |
| excluding fruits and vegetables | 906 | 106.2 | +1.5 | +3.2 | +3.2 |
| Crop output (excluding fruits and vegetables) | 489 | 111.6 | +3.1 | +6.0 | +7.7 |
| Cereals | 152 | 120.1 | +10.7 | +22.7 | +30.3 |
| of which soft wheat | 90 | 123.0 | +10.3 | +27.2 | +33.6 |
| grain maize | 27 | 116.1 | +11.3 | +12.3 | +20.7 |
| Potatoes | 29 | 129.9 | /// | /// | –23.7 |
| Wines | 200 | 109.5 | –1.5 | –2.1 | +4.6 |
| PDO wines | 112 | 118.9 | +0.9 | –2.4 | +7.8 |
| other wines | 25 | 89.8 | –16.4 | –5.4 | 0.0 |
| Oleaginous | 40 | 95.7 | +4.1 | +5.5 | +0.8 |
| Horticultural products | 35 | 100.0 | –1.0 | –1.0 | –1.6 |
| Other crop products | 33 | 100.8 | +1.0 | +1.4 | –3.7 |
| Fruits and vegetables (1) | 94 | 107.1 | /// | /// | +5.0 |
| Fresh vegetables | 45 | 103.6 | /// | /// | +10.1 |
| Fresh fruits | 32 | 121.3 | /// | /// | +14.8 |
| Animal output | 417 | 99.9 | –0.4 | –0.2 | –2.3 |
| Animals | 255 | 97.0 | –0.4 | –1.0 | –2.7 |
| of which large cattle | 112 | 97.7 | –0.9 | –0.3 | –0.3 |
| calves | 20 | 101.6 | –0.5 | +0.3 | +3.6 |
| pigs | 49 | 91.3 | +1.4 | –4.5 | –13.1 |
| sheep | 14 | 99.2 | –3.4 | –2.3 | –2.7 |
| poultry | 57 | 97.4 | +0.1 | +0.3 | –1.2 |
| of which chicken | 39 | 97.3 | 0.0 | +0.4 | –1.4 |
| Milk | 146 | 106.9 | /// | +1.9 | +0.2 |
| of which cow milk (2) | 135 | 107.3 | /// | +2.1 | +0.1 |
| Eggs | 16 | 83.3 | –4.7 | –7.6 | –16.9 |
- /// Absence of meaning due to the nature of these series
- (1) Including vegetables for industry.
- (2) The July value of cow milk price index is the estimate of the August one. The previous month variation is the one commented in the text: +0,2% over one year in July 2018.
- Sources: INSEE, SSP (ministry in charge of agriculture)
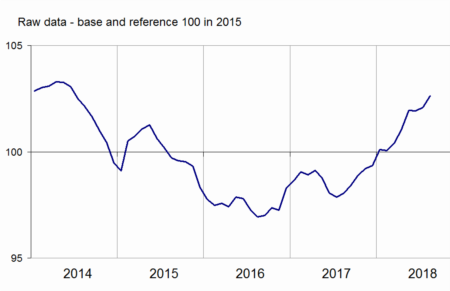
New rise in purchase prices of means of production over one month
In August 2018, intermediate consumption prices were up by 0.6% over one month, after + 0.3% in July. Energy prices (+0.7%) and especially feed prices (+1.0%) and fertilizer and amendments prices (+1.6%) contributed to this rise. Over one year, the prices of intermediate consumption accelerated (+5.0% after +4.6% in July) due to energy prices (+20.5% over one year) and those of fertilizer and amendments (+ 8.5%).
Prices for capital goods increased by 0.4% over one month and by 4.0% over one year.
Revision
The variation over one year of IPPAP has been rosen by 0.1 points in June to +1,3%; The one of IPAMPA is unchanged.
graphiqueGraph4 – Purchase prices of the means of agricultural production
- Sources: INSEE, SSP (ministry in charge of agriculture)
tableautable2 – Indices of purchase prices of the means of agricultural production (IPAMPA)
| Variation as % over | |||||
|---|---|---|---|---|---|
| Weights | August 2018 | a month | 3 months | a year | |
| Total input | 1000 | 102.6 | +0.5 | +0.6 | +4.7 |
| Intermediate consumptions | 760 | 101.3 | +0.6 | +0.7 | +5.0 |
| Energy | 93 | 118.7 | +0.7 | –0.5 | +20.5 |
| Seeds | 56 | 97.7 | +0.3 | +0.3 | +0.7 |
| Fertilisers and soil improvers | 107 | 89.7 | +1.6 | +2.3 | +8.5 |
| Plant protection products | 84 | 99.4 | –0.3 | –0.5 | +0.8 |
| Animal feed | 214 | 98.3 | +1.0 | +1.4 | +2.6 |
| Veterinary expenses | 37 | 106.9 | +0.1 | +0.3 | +2.1 |
| Small equipment and tools | 11 | 101.6 | +0.5 | +1.7 | +1.5 |
| Maintenance of materials | 88 | 105.0 | +0.3 | +0.3 | +2.4 |
| Maintenance of buildings | 9 | 104.9 | 0.0 | 0.0 | +1.7 |
| Other goods and services | 61 | 101.7 | 0.0 | +0.1 | 0.0 |
| Goods and services contributing to investment | 240 | 107.0 | +0.4 | +0.8 | +4.0 |
| Material | 168 | 106.3 | +0.5 | +0.7 | +3.4 |
| Tractors | 71 | 110.0 | +0.6 | +0.6 | +5.0 |
| Machinery and equipment for cultivation | 33 | 105.0 | +0.1 | +0.6 | +2.5 |
| Machinery and equipment for harvesting | 38 | 103.8 | +0.9 | +0.9 | +2.2 |
| Utility vehicles | 16 | 100.2 | +0.4 | +0.8 | +0.1 |
| Buildings | 72 | 108.6 | 0.0 | +0.8 | +5.5 |
- (1) The repayment of the domestic tax on energy product (TICPE) benefiting farmers has been applied in advance for the year 2018.
- Sources: INSEE, SSP (ministry in charge of agriculture)
Pour en savoir plus
Time series : Indices of agricultural prices