28 September 2018
2018- n° 257At the end of Q2 2018, the Maastricht debt accounted for €2,299.8 billion Debt of the general government according to the Maastricht definition - second quarter
2018
28 September 2018
2018- n° 257At the end of Q2 2018, the Maastricht debt accounted for €2,299.8 billion Debt of the general government according to the Maastricht definition - second quarter
2018
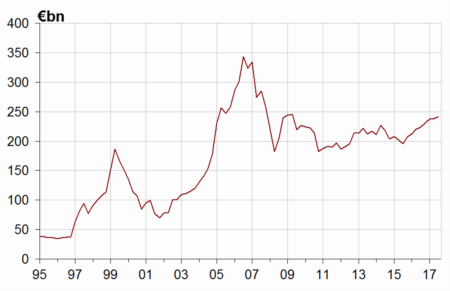
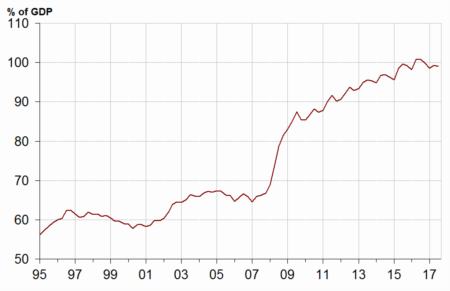
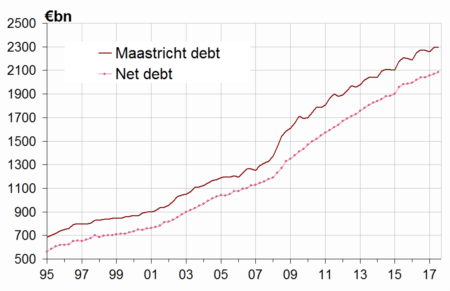
At the end of Q2 2018, the Maastricht debt reached €2,299.8 billion, a €5.2 billion increase in comparison to Q1 2018. It accounted for 99.0% of gross domestic product (GDP), 0.3 points lower than last quarter's level. By contrast, the net public debt increased more (€ +14.4 billion).
- The Maastricht debt increased by €5.2 billion compared to the previous quarter
- State debt went up
- Central agencies, local government and social security funds debts went down
- In Q2 2018, the net public debt increased by €14.4 billion
- The overall value of quoted shares and mutual fund shares held by general government increased again

Warnings: Quarterly debt figures are based on an accounting data source less exhaustive than the annual accounts. Results may therefore be updated during several quarters.
Quarterly debt variations are not equal to the estimated deficit for the current quarter. To obtain the deficit from the change in the Maastricht gross public debt, net acquisitions of financial assets and of liabilities excluded from the Maastricht debt definition must also be taken into consideration, as well as the fact that the Maastricht debt is in nominal value. Moreover, the quarterly deficit published by INSEE is seasonally and trading-day adjusted, which is not the case of the quarterly debt.
This publication takes into account the reclassification of SNCF Réseau as part of the general government from the beginning of the year 2016. For more information, please refer to the press release issued on 6 September 2018: https://www.insee.fr/fr/information/3607979.
The Maastricht debt increased by €5.2 billion compared to the previous quarter
At the end of Q2 2018, the Maastricht debt reached €2,299.8 billion, a €5.2 billion increase in comparison to Q1 2018. It accounted for 99.0% of gross domestic product (GDP), 0.3 points lower than last quarter's level. By contrast, the net public debt increased more (€ +14.4 billion).
State debt went up
In the second quarter of 2018, the State contribution to the debt increased by €19.5 billion. This rise stemmed mainly from long-term negotiable debt (€ +24.9 billion) and to a lesser extent from deposits at the French Treasury (€ +1.7 billion). Short-term negotiable debt diminished (€ −7.1 billion).
Central agencies, local government and social security funds debts went down
In Q2 2018, the central agencies contribution to the debt went down by € 2.0 billion due exclusively to the Caisse nationale des autoroutes (CNA).
Local government contribution to the debt went down more moderately (by € −0.7 billion): municipalities paid off € 0.5 billion, departments and regions both € 0.3 billion. Conversely, other units in local government borrowed € 0.5 billion.
The contribution of social security funds went down sharply (€ −11.7 billion) above all because of CADES (€ −10.8 billion) and to a lesser extent because of ACOSS (€ −1.0 billion), CNAF (€ −0.8 billion), CNAM (€ −0.3 billion) and hospitals (€ −0.1 billion). Conversely, UNEDIC increased its debt (€ +1.3 billion).
graphiqueGraphIR – General government debt under the Maastricht treaty (% of GDP) (*)
tableauTableauA – General government debt under the Maastricht treaty by sub-sector and by category
| 2017Q2 | 2017Q3 | 2017Q4 | 2018Q1 | 2018Q2 | |
|---|---|---|---|---|---|
| General Government | 2,274.0 | 2,269.2 | 2,257.8 | 2,294.6 | 2,299.8 |
| %of GDP | 100.9% | 99.8% | 98.5% | 99.3% | 99.0% |
| of which. by sub-sector : | |||||
| State | 1,783.2 | 1,788.0 | 1,768.1 | 1,808.8 | 1,828.4 |
| Central agencies | 60.6 | 61.3 | 61.9 | 62.1 | 60.1 |
| Local Government | 198.1 | 196.6 | 201.5 | 200.1 | 199.4 |
| Social security funds | 232.1 | 223.3 | 226.2 | 223.6 | 211.9 |
| of which. by category | |||||
| Currency and deposits | 37.4 | 38.9 | 37.4 | 39.4 | 41.1 |
| Securities other than shares | 1,957.4 | 1,953.2 | 1,938.5 | 1,975.7 | 1,980.7 |
| short-term | 201.8 | 188.5 | 170.6 | 185.5 | 169.8 |
| long-term | 1,755.6 | 1,764.7 | 1,768.0 | 1,790.3 | 1,810.9 |
| Loans | 279.2 | 277.1 | 281.8 | 279.5 | 278.0 |
| short-term | 8.2 | 7.2 | 7.0 | 7.7 | 7.6 |
| long-term | 271.0 | 269.9 | 274.8 | 271.8 | 270.4 |
- (*) Explanations in the box "For more details"
- Source: National Accounts 2014 basis - Insee. DGFiP. Banque de France
In Q2 2018, the net public debt increased by €14.4 billion
At the end of Q2 2018, the net public debt reached €2,085.0 billion (equivalent to 89.7% of GDP versus 89.6% in Q1 2018), a €14.4 billion increase compared to the previous quarter. The €9.2 billion gap between changes in net and gross debt is explained by a decrease in the cash position of the State (€ −2.9 billion), central agencies (€ −2.2 billion) and social security funds (€ −4.4 billion).
tableauTableauB – General government net debt by sub-sector
| 2017Q2 | 2017Q3 | 2017Q4 | 2018Q1 | 2018Q2 | |
|---|---|---|---|---|---|
| General government | 2,041.1 | 2,040.0 | 2,054.7 | 2,070.6 | 2,085.0 |
| of which : | |||||
| The State | 1,655.6 | 1,669.2 | 1,668.6 | 1,691.2 | 1,713.7 |
| Central agencies | 44.4 | 45.0 | 45.5 | 46.2 | 46.4 |
| Local government | 185.7 | 184.3 | 189.4 | 187.9 | 187.1 |
| Social security funds | 155.4 | 141.5 | 151.1 | 145.3 | 137.8 |
- Source: National Accounts 2014 basis - Insee, DGFiP, Banque de France
graphiqueGraph_dette_nette – Maastricht gross debt and net debt
The overall value of quoted shares and mutual fund shares held by general government increased again
In Q2 2018, the overall value of quoted shares and mutual fund shares held by general government units went up to €241.6 billion, a €3.3 billion increase compared to Q1 2018.
The quoted shares held by the State increased by €1.9 billion because of the rise in EDF's, Aéroports de Paris's, Safran's and Thales's share prices. The State also transferred €9.3 billion of shares to Bpifrance as part of the Fonds pour l'innovation: these transactions were neutral for general government as a whole.
The value of mutual fund shares increased (€ +1.1 billion) due notably to the acquisitions of the Caisse nationale d'assurance vieillesse des professions libérales for €0.5 billion and UNEDIC for €0.2 billion.
tableauTableauC – General government holdings of quoted shares and mutual fund shares
| 2017Q2 | 2017Q3 | 2017Q4 | 2018Q1 | 2018Q2 | |
|---|---|---|---|---|---|
| General government | 223.4 | 230.6 | 237.0 | 238.3 | 241.6 |
| of which : | |||||
| The State | 58.0 | 61.1 | 64.9 | 66.7 | 59.3 |
| Central agencies | 35.4 | 36.5 | 36.3 | 36.6 | 46.6 |
| Local government | 0.1 | 0.1 | 0.1 | 0.1 | 0.1 |
| Social security funds | 129.9 | 132.9 | 135.8 | 134.9 | 135.7 |
- Source: National Accounts 2014 basis - Insee, DGFiP, Banque de France
graphiqueGraph_F5 – General government holdings of quoted shares and mutual fund shares