

 25 September 2018
2018- n° 253In September 2018, the business climate picks up in wholesale trade Bi-monthly survey of wholesaling - September 2018
25 September 2018
2018- n° 253In September 2018, the business climate picks up in wholesale trade Bi-monthly survey of wholesaling - September 2018
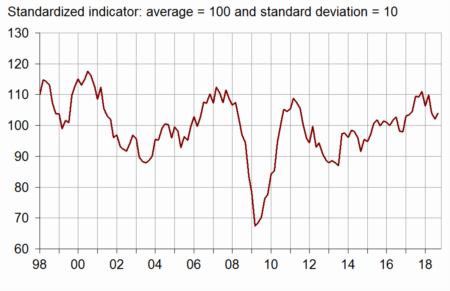
According to the managers surveyed in September 2018, the business climate has improved in the wholesale trade sector. The composite indicator has gained two points compared to July 2018. At 104, it stands above its long-term average (100), which it has exceeded since January 2017. Besides, the business climate of July has been raised by one point due to the integration of late businesses' answers.
- The balances of opinion on past activity have picked up
- Less optimistic activity prospects
- Employment balances remain above their average
- Prices are more often expected to rise
- Raw agricultural products and live animals
- Food products and beverages
- Household goods
- Capital goods in information and communication
- Other industrial capital goods
- Other specialised wholesale trade
According to the managers surveyed in September 2018, the business climate has improved in the wholesale trade sector. The composite indicator has gained two points compared to July 2018. At 104, it stands above its long-term average (100), which it has exceeded since January 2017. Besides, the business climate of July has been raised by one point due to the integration of late businesses' answers.
graphiqueChart_1 – Composite indicator
The turning-point indicator remains in the area indicating an uncertain short-term economic situation.
graphiqueChart_2 – Turning-point indicator
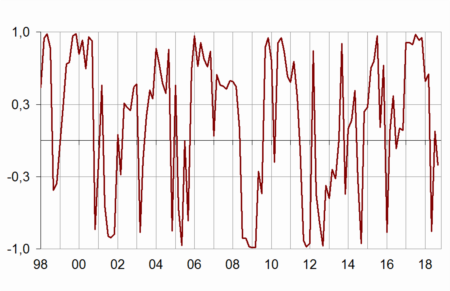
- Note: close to 1 (respectively -1), this indicator points to a favourable short-term economic situation (respectively unfavourable). Between -0,3 et +0,3: short-term economic uncertainty.
The balances of opinion on past activity have picked up
In Septembrer, more wholesalers than in July have indicated an increase in their past sales and their received merchandise, both total and foreign. The corresponding balances of opinion have returned above their average.
Less optimistic activity prospects
The three balances about ordering intentions from France or abroad and shipments abroad have faltered. The balance on general business outlook for the overall trade sector has kept sliding since March. However, each of these four balances remains above its mean level.
Employment balances remain above their average
The balance of opinion concerning past workforce has piked up while that on expected employment has decreased. Both balances remain above average.
Prices are more often expected to rise
As many wholesalers as in July have declared a rise in their past prices but more of them have forecast rising prices for the next few months. The first of the two balances stands above its average; the second one is just below it.
tableauTable_1 – Total wholesale trade
| Ave.* | Mar. 18 | May 18 | July 18 | Sept. 18 | |
|---|---|---|---|---|---|
| Composite indicator | 100 | 110 | 104 | 102 | 104 |
| General business outlook | –23 | 16 | 8 | 0 | –7 |
| Sales | –14 | –3 | –10 | –15 | –10 |
| export sales | –15 | –5 | –12 | –18 | –13 |
| Received merchandise | –9 | –1 | –6 | –10 | –7 |
| received from abroad | –10 | –4 | –13 | –13 | –9 |
| Ordering intentions | –15 | –5 | –7 | –7 | –9 |
| ordering from abroad | –15 | –4 | –9 | –8 | –12 |
| Shipments abroad | –15 | –4 | –10 | –8 | –11 |
| Current stock | 8 | 8 | 8 | 9 | 8 |
| Past workforce | –1 | 5 | 3 | 2 | 6 |
| Expected workforce | –2 | 10 | 9 | 9 | 6 |
| Cash position | –9 | –4 | –3 | –5 | –5 |
| Past selling prices | 7 | 4 | 7 | 9 | 9 |
| Expecting selling prices | 14 | 13 | 7 | 8 | 13 |
- * : average since September 1979
- Source: INSEE - business tendency survey in wholesale trade
Raw agricultural products and live animals
In agricultural wholesale sector, more managers than in July have declared an increase in their past activity – sales, exports and imports. Nevertheless, the balance concerning ordering intentions has faltered. These four balances remain below their average.
Food products and beverages
In the food wholesaling sector, the balance concerning past sales and imports have risen and exceed their average again. The one about export sales has also increased but stays below its average. The balance about ordering intentions has slipped back but remains above its average.
Household goods
In this sector, the balances concerning past total sales and exports sales have picked up. The one about export sales has moved just above its average but the one on total sales remains below. The balance related to imports keeps decreasing. The one about ordering intentions continues to decline but stays above its average.
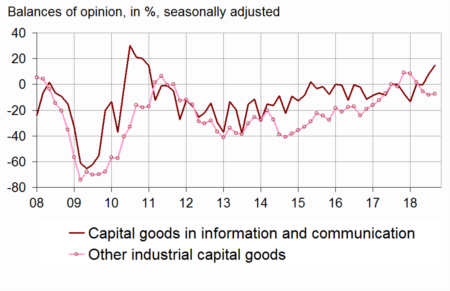
Capital goods in information and communication
In that type of wholesale trade, more managers than in July have declared an increase in their past and future activity. The four balances stand above their average. The one concerning past sales has reached its highest point in seven years.
Other industrial capital goods
In that type of wholesale trade the balances concerning past total sales and ordering intentions are practically stable. The one concerning imports has kept sliding down while the one about exports has picked up. Each of the four remain above its average.
Other specialised wholesale trade
In this sector, more traders than in July have declared a fall in their past sales, total and abroad, and in their ordering intentions. Concerning merchandise received from abroad, the balance of opinion has recovered. However, the four balances remain above their mean level.
graphiqueChart_3 – Past activity (sales) in capital goods
tableauTable_2 – Wholesale trade sectors
| Ave. * | Mar. 18 | May 18 | July 18 | Sept. 18 | |
|---|---|---|---|---|---|
| Raw agricultural products and live animals | |||||
| Sales | –13 | –15 | –28 | –27 | –18 |
| Export sales | –16 | –5 | –21 | –41 | –32 |
| Merchandise received from abroad | –9 | –15 | –38 | –21 | –17 |
| Ordering intentions | –12 | –17 | –18 | –16 | –22 |
| Current stock | 5 | 10 | 10 | 14 | 6 |
| Food products and beverages | |||||
| Sales | –14 | –3 | –13 | –16 | –9 |
| Export sales | –12 | –12 | –16 | –18 | –13 |
| Merchandise received from abroad | –13 | –18 | –27 | –21 | –12 |
| Ordering intentions | –11 | –2 | –8 | –4 | –7 |
| Current stock | 5 | 3 | 7 | 3 | 2 |
| Household goods | |||||
| Sales | –10 | –6 | –15 | –25 | –18 |
| Export sales | –11 | 4 | –8 | –18 | –10 |
| Merchandise received from abroad | –5 | 8 | –3 | –9 | –11 |
| Ordering intentions | –14 | –1 | –5 | –8 | –11 |
| Current stock | 12 | 9 | 7 | 9 | 1 |
| Capital goods in information and communication | |||||
| Sales | –8 | 0 | 0 | 8 | 15 |
| Export sales | –13 | –9 | –6 | –3 | 4 |
| Merchandise received from abroad | –7 | –4 | –12 | –10 | –5 |
| Ordering intentions | –10 | –8 | –7 | –2 | 1 |
| Current stock | 8 | 9 | 3 | 13 | 16 |
| Other industrial capital goods | |||||
| Sales | –16 | 2 | –5 | –8 | –7 |
| Export sales | –21 | –3 | –11 | –17 | –13 |
| Merchandise received from abroad | –11 | 0 | –1 | –4 | –7 |
| Ordering intentions | –21 | –6 | –2 | –8 | –7 |
| Current stock | 11 | 9 | 14 | 15 | 17 |
| Other specialized wholesale trade | |||||
| Sales | –17 | –4 | 2 | –11 | –13 |
| Export sales | –19 | –6 | –12 | –11 | –16 |
| Merchandise received from abroad | –12 | –3 | –4 | –7 | –3 |
| Ordering intentions | –18 | –1 | –4 | –6 | –8 |
| Current stock | 6 | 12 | 9 | 7 | 11 |
- * : average since September 1979
- Source: INSEE - business tendency survey in wholesale trade
Pour en savoir plus
Time series : Wholesale trade