

 31 August 2018
2018- n° 226In July 2018, producer prices in industry rose (+0.5%) Industrial Producer and Import Price Indices - July 2018
31 August 2018
2018- n° 226In July 2018, producer prices in industry rose (+0.5%) Industrial Producer and Import Price Indices - July 2018
On all markets (French market and foreign markets), producer prices in industry rose for the third consecutive month (+0.5% after +0.2% in June and +0.7% in May) and accelerated year over year (+3.7% after +3.2% in June).
Producer prices in French industry: +0.5% in July 2018
On all markets (French market and foreign markets), producer prices in industry rose for the third consecutive month (+0.5% after +0.2% in June and +0.7% in May) and accelerated year over year (+3.7% after +3.2% in June).
FRENCH MARKET: +0.6%
After the previous month virtual stability (+0,1%), French producer prices in industry for the French market grew by 0.6%, due to the rise in prices of mining and quarrying products, energy and water and, to a lesser extent, of manufactured product prices.
Increase in prices of mining and quarrying products, energy and water
The prices of mining and quarrying products, energy and water sped up in July, monthly (+1.8% after +1.2%), as well as year over year (+5.8% after +4.2%). The electricity selling prices increased, essentially on the wholesale market. Gas prices grew in relation to regulated tariff increase.
Rebound in prices of refined petroleum products
In July, the prices of refined petroleum products bounced back (+0.8% after –1.4%). Year over year, the rise remained very sharp (+42.6% in July after +45.2% in June).
Slight increase in food and beverage prices
In July, food and beverage prices rose slightly (+0.2% after −0.1%). Year over year, they were almost unchanged.
Slight increase in prices of “other industrial products”
In July, the prices of “other industrial products” rose by 0.2%. Chemical product prices kept increasing, in the wake of the past surges in raw material prices. Year over year, prices of “other industrial products” grew by 2.5% (after +2.0% in June).
FOREIGN MARKETS: +0.2%
In July 2018, the producer prices of French industrial products sold on foreign markets rose by 0.2% (after +0.6% in June), essentially due to the surge in electricity wholesale market selling prices. Manufactured product prices were unchanged (after +0.2%). Those of refined petroleum products rose sligthly (+0.3%). Metal product prices fell back (−1.3% after +1.0% in June), in the wake of the metal prices. Year over year, export prices of industrial products accelerated (+2.9% after +2.5% in June).
Import price indices of industrial products: +0.4% in July
In July 2018, the import prices of industrial products rose by 0.4%, after +0.3% in June. The prices of mining and quarrying products, energy and water prices increased, due to the sharp rise in electricity and gas selling prices. Food product prices grew for the fifth consecutive month (+0.2% in July) but remained decreasing year over year (−0.8%). Prices of refined petroleum products edged up (+0.2% after −1.2% in June). Year over year, import prices kept speeding up (+5.2% after +4.4% in June).
graphiqueGraph1 – Total Industry price indices
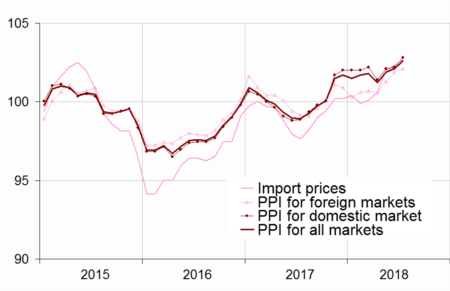
- Reference year: 2015
- Source: INSEE
graphiqueGraph2 – Producer price indices of manufactured products sold on the French market
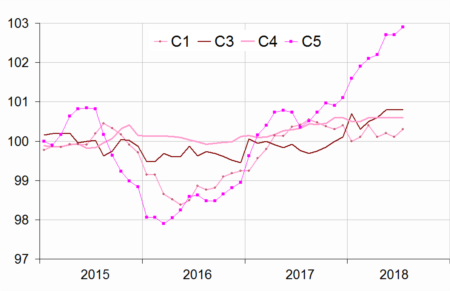
- Reference year: 2015
graphiqueGraph3 – Producer price indices of coke and refined petroleum products sold on the French market
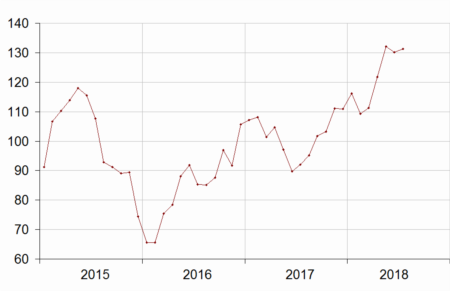
- Reference year: 2015
- Source: INSEE
tableauTable1 – French Producer Price Indices in industry according to the market where the products are sold:
| Change in % | ||||
|---|---|---|---|---|
| Levels A 10 and A 17 in CPF rev. 2, 2008 | Weight | Jul.18 | In 1 month | In 1 year |
| French market | ||||
| BE:TOTAL INDUSTRY | 1000 | 102.8 | 0.6 | 4.0 |
| (DE) Mining and quarrying, energy, water | 215 | 101.1 | 1.8 | 5.8 |
| CZ: Manufactured prod. | 785 | 103.2 | 0.2 | 3.5 |
| (C1) Food products, beverages, tobacco | 194 | 100.3 | 0.2 | –0.1 |
| (C2) Coke and refined petroleum products | 46 | 131.3 | 0.8 | 42.6 |
| (C3) Electrical & electronic equip., computers, mach. | 69 | 100.8 | 0.0 | 1.0 |
| (C4) Transport equipment | 125 | 100.6 | 0.0 | 0.3 |
| (C5) Other man. products | 351 | 102.9 | 0.2 | 2.5 |
| Foreign markets | ||||
| BE:TOTAL INDUSTRY | 1000 | 102.1 | 0.2 | 2.9 |
| CZ: Manufactured prod. | 980 | 101.6 | 0.0 | 2.2 |
| (C1) Food products, beverages, tobacco | 121 | 99.7 | –0.1 | –1.0 |
| (C2) Coke and refined petroleum products | 34 | 126.0 | 0.3 | 39.5 |
| (C3) Electrical & electronic equip., computers, mach. | 151 | 99.6 | –0.1 | 0.4 |
| (C4) Transport equipment | 207 | 101.0 | 0.0 | 1.0 |
| (C5) Other man. products | 467 | 101.1 | –0.1 | 1.6 |
| All markets | ||||
| BE:TOTAL INDUSTRY | 1000 | 102.6 | 0.5 | 3.7 |
| CZ: Manufactured prod. | 835 | 102.7 | 0.1 | 3.1 |
| (C1) Food products, beverages, tobacco | 175 | 100.2 | 0.2 | –0.3 |
| (C2) Coke and refined petroleum products | 43 | 129.7 | 0.8 | 42.0 |
| (C3) Electrical & electronic equip., computers, mach. | 90 | 100.3 | 0.0 | 0.8 |
| (C4) Transport equipment | 146 | 100.7 | 0.0 | 0.5 |
| (C5) Other man. products | 381 | 102.3 | 0.0 | 2.2 |
- Source: INSEE
tableauTable2 – Import prices of industrial products
| Change in % | ||||
|---|---|---|---|---|
| Levels A 10 and A 17 in CPF rev. 2, 2008 | Weight | Jul.18 | In 1 month | In 1 year |
| BE:TOTAL INDUSTRY | 1000 | 102.7 | 0.4 | 5.2 |
| CZ: Manufactured prod. | s | 101.3 | 0.0 | 2.4 |
| (C1) Food products, beverages, tobacco | 77 | 104.0 | 0.2 | –0.8 |
| (C2) Coke and refined petroleum products | 40 | 126.6 | 0.2 | 45.5 |
| (C3) Electrical & electronic equip., computers, mach. | 219 | 98.3 | 0.0 | 0.1 |
| (C4) Transport equipment | 180 | 99.8 | 0.2 | 0.5 |
| (C5) Other manufactured products | s | 100.5 | –0.1 | 1.3 |
- nd: non available; s: confidential
- Source: INSEE
tableauTable3 – Revision of variations
| Apr.18 / Mar.18 | May 18 / Apr.18 | Jun.18 / May 18 | |
|---|---|---|---|
| French producer prices in industry sold on: | |||
| - the French market | // | // | // |
| - the foreign markets | // | +0.1 | // |
| - all markets | // | +0.1 | –0.1 |
| Import prices of industrial products | // | // | –0.1 |
- How to read it: the variation of the producer price index in industry for products sold on the French market between May 2018 and June 2018 is unchanged: +0.1%, as it was published in July.
- Source: INSEE