

 23 August 2018
2018- n° 218In August 2018, the business climate is virtually stable in services Monthly survey of services - August 2018
23 August 2018
2018- n° 218In August 2018, the business climate is virtually stable in services Monthly survey of services - August 2018
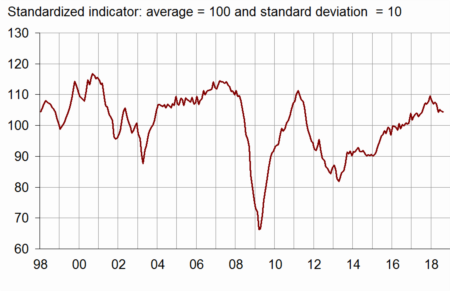
According to business managers surveyed in August 2018, the business climate in services is virtually stable. At 104, the business climate composite indicator remains above its long-term average (100).
- The balances of opinion on past activity and on general outlook have fallen
- In road transport, the business climate is less brigth
- The business climate in accommodation and food services has improved again
- The business climate is stable in information and communication
- The business climate remains deteriorated in real estate activities
- In professional activities, the business climate has weakened again
- The business climate remains stable in administrative and support service activities

Warning: the seasonal coefficients as well as the parameters of the composite indicators have been updated in August 2018. That has led to revisions in the set of results previously published from this survey.
According to business managers surveyed in August 2018, the business climate in services is virtually stable. At 104, the business climate composite indicator remains above its long-term average (100).
graphiqueGraph 1 – Business climate composite indicator
In August 2018, the turning point indicator stands in the area indicating a favourable short-term economic situation.
graphiqueGraph 2 – Turning point indicator
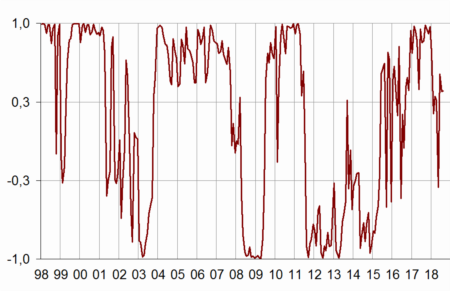
- Note: close to 1 (respectively –1), this indicator indicates a favourable short-term economic situation (respectively unfavourable). The uncertainty area is between –0.3 and +0.3.
The balances of opinion on past activity and on general outlook have fallen
The balance of opinion on general outlook over their sector has markedly fallen back and that on past activity has decreased again. However the balance on expected demand has gone up slightly and that on expected activity holds steady. All of these balances stand above their long-term average.
The balances on selling prices have sharply bounced back and returned above their average.
The balance on past employment has weakened a little again but stands above its average whereas that on expected employment has markedly bounced back, well above its average.
The balance on past investments has improved again and reached its highest level since April 2008. That on expected investments has barely faltered and stands above its average.
tableauTable 1 – Economic outlook in the services sector
| Average* | May 18 | June 18 | July 18 | Aug. 18 | |
|---|---|---|---|---|---|
| Composite indicator | 100 | 104 | 105 | 105 | 104 |
| General outlook | –7 | 0 | –1 | 0 | –4 |
| Past activity | 2 | 2 | 8 | 5 | 3 |
| Expected activity | 2 | 2 | 4 | 4 | 4 |
| Expected demand | 0 | 4 | 4 | 5 | 6 |
| Past selling prices | –4 | –2 | –1 | –7 | –1 |
| Expected selling prices | –3 | –2 | –5 | –5 | –1 |
| Past employment | 3 | 3 | 9 | 6 | 5 |
| except temporary work agencies | 1 | 0 | 5 | 1 | 0 |
| Expected employment | 3 | 11 | 9 | 6 | 11 |
| except temporary work agencies | 0 | 6 | 5 | 4 | 5 |
| Investments | |||||
| Past investments | 2 | 6 | 4 | 7 | 11 |
| Expected investments | 2 | 7 | 6 | 6 | 5 |
- * Average since 1989 for the composite indicator and since 1988 for the balances of opinion
- Source: INSEE, monthly business survey in services.
The business climate composite indicator is above its long-term average in almost all sub-sectors. Only the climate in real estate activities remains below to its average, despite a slight upturn. It has improved again in accommodation and food service activities. It is stable in information and communication and in administrative and support service activities. It has declined in road transport and in professional, scientific and technical activities.
In road transport, the business climate is less brigth
In road transport, the business climate indicator has lost four points in August. At 110, it stands however significantly above its average level. All balances have fallen back, particularly those on general outlook, expected activity and expected demand. All balances remain nevertheless above their average.
The business climate in accommodation and food services has improved again
The business climate in accommodation and food services has gained five points and reached its highest level since March 2011. The balances on general outlook and expected employment have strongly increased. Only the balance on past activity, on sharp fall, has returned just below its long-term average.
The business climate is stable in information and communication
In information and communication, the business climate is stable (101). The decrease in the balances on expected activity, on past employment and on general outlook is offset by the increase in that on past activity and on expected employment. The balances on expected activity, on expected demand and on general outlook are below their average.
The business climate remains deteriorated in real estate activities
In real estate activities, the climate has gained one point (85) but has remained far below its average level since autumn 2017. The balances on the recent developments in activity and employment have gone down again. However, the balances corresponding to the business managers' expectations have strengthened. Only the balances on expected demand and expected employment are above their average.
In professional activities, the business climate has weakened again
The business climate in professional, scientific and technical activities has lost one point (103) but stands above its long-term average. The balances of opinion on expected activity and on general outlook have decreased whereas that on past activity has bounced back.
The business climate remains stable in administrative and support service activities
In administrative and support service activities, the climate has been stable since June 2018. At 108, it remains well above its average. The decline in the balances on past activity, on past employment and on general outlook is offset by the rise in those on expected activity, expected demand and expected employment. All balances are above their average.
tableauTable 2 – Business climate composite indicator and balances of opinion by sub-sector in services
| Aggregated classification (NA 2008) at level A21 | Mean* | May 18 | June 18 | July 18 | Aug . 18 |
|---|---|---|---|---|---|
| Road transport (8%) | |||||
| Composite indicator | 100 | 110 | 111 | 114 | 110 |
| Past activity | –6 | 6 | 7 | 17 | 13 |
| Expected activity | –7 | 6 | 8 | 14 | 5 |
| Expected demand | –10 | 10 | 16 | 18 | 10 |
| Past employment | –5 | 8 | 6 | 8 | 5 |
| Expected employment | –8 | 4 | 0 | 5 | 2 |
| General outlook | –20 | 6 | 2 | 5 | –7 |
| Accommodation and food service activities (11%) | |||||
| Composite indicator | 100 | 108 | 108 | 113 | 118 |
| Past activity | –7 | –4 | –1 | –1 | –8 |
| Expected activity | –7 | –2 | 1 | 10 | 13 |
| Expected demand | –9 | –1 | –1 | 4 | 7 |
| Past employment | –4 | –6 | 2 | 0 | –3 |
| Expected employment | –5 | 3 | –5 | 1 | 9 |
| General outlook | –13 | –3 | –5 | –3 | 7 |
| Information and communication (24%) | |||||
| Composite indicator | 100 | 101 | 102 | 101 | 101 |
| Past activity | 8 | –6 | 10 | 10 | 14 |
| Expected activity | 9 | 3 | 9 | 7 | 5 |
| Expected demand | 10 | 3 | 2 | 4 | 4 |
| Past employment | 6 | 12 | 9 | 8 | 6 |
| Expected employment | 11 | 13 | 13 | 12 | 14 |
| General outlook | 0 | 3 | 3 | 1 | –2 |
| Real estate activities (13%) | |||||
| Composite indicator | 100 | 88 | 87 | 84 | 85 |
| Past activity | 7 | 6 | 6 | 0 | –11 |
| Expected activity | 7 | –7 | –10 | –8 | –1 |
| Expected demand | 2 | 4 | 5 | 3 | 5 |
| Past employment | 3 | 2 | 2 | –2 | –10 |
| Expected employment | 3 | 6 | 7 | –3 | 6 |
| General outlook | –3 | –17 | –19 | –16 | –15 |
| Professional, scientific and technical activities (24%) | |||||
| Composite indicator | 100 | 106 | 108 | 104 | 103 |
| Past activity | –1 | 7 | 9 | –2 | 1 |
| Expected activity | –2 | 1 | 7 | 0 | –4 |
| Expected demand | –5 | 0 | 0 | 2 | 3 |
| Past employment | 1 | 4 | 13 | 1 | 0 |
| Expected employment | 0 | 12 | 9 | 1 | 1 |
| General outlook | –9 | –1 | –1 | –3 | –5 |
| Administrative and support service activities (18%) | |||||
| Composite indicator | 100 | 107 | 108 | 108 | 108 |
| Past activity | 6 | 12 | 18 | 13 | 8 |
| Expected activity | 5 | 9 | 8 | 11 | 17 |
| Expected demand | 3 | 12 | 13 | 13 | 15 |
| Past employment | 10 | 6 | 13 | 14 | 12 |
| Expected employment | 8 | 20 | 14 | 11 | 19 |
| General outlook | –4 | 9 | 7 | 9 | 2 |
- The figures in parentheses indicate the weights used to aggregate the sub-sector balances of opinion.
- *Composite indicator: average since 1989 (2006 for road transport); balances of opinion: average since 1988 (2006 for road transport)
- Source: INSEE, monthly business survey in services.
Documentation
Abbreviated Methodology (2017) (pdf,177 Ko)
Pour en savoir plus
Time series : Economic outlook surveys – Services