

 22 August 2018
2018- n° 214In July, oil prices were virtually stable Prices of oil and raw material imports - July 2018
22 August 2018
2018- n° 214In July, oil prices were virtually stable Prices of oil and raw material imports - July 2018
In July 2018, the price of North Sea crude oil (Brent) in euros was virtually stable (−0.3 % after −2.2%). It reached an average of €63.5 per barrel. The slight decrease in July was less marked in dollars (−0.2% after −3.2%).

Warning: This issue only comments oil prices evolvement. Indeed, some data sets used to compute the imported raw materials indices (excluding energy) will temporarily not be published by the World Bank, the main source for this data. Imported raw materials indices (excluding energy) will not be commented until World Bank issues resurgence (announced for September).
In detail, prices and indices of sunflower oil, rapeseed oil, tea, rice, sheep meat, poultry, shrimps, iron ore, and tropical wood will not be updated in the Insee macroeconomic databank (BDM). However, prices and indices of other imported raw materials are available in this database.
Oil prices were virtually stable
In July 2018, the price of North Sea crude oil (Brent) in euros was virtually stable (−0.3 % after −2.2%). It reached an average of €63.5 per barrel. The slight decrease in July was less marked in dollars (−0.2% after −3.2%).
tableauTable1 – Oil and petroleum products
| Prices | Change (%) | |||
|---|---|---|---|---|
| of last month | over the last month | over the last 3 months | over the last 12 months | |
| Brent in $ per barrel | 74,2 | –0,2 | 3,2 | 51,1 |
| Brent in € per barrel | 63,5 | –0,3 | 8,1 | 49,0 |
| Gasoline cts €/L | 46,9 | 2,1 | 8,8 | 30,5 |
| Gas Oil | 562,0 | –0,2 | 8,4 | 42,9 |
| Heavy fuel | 391,9 | 2,3 | 20,6 | 44,2 |
| Naphtha | 549,5 | 1,1 | 12,7 | 51,8 |
- Prices are in euros per tonne unless otherwise specified
- Source: INSEE
graphiqueGraph1 – Oil (Brent)
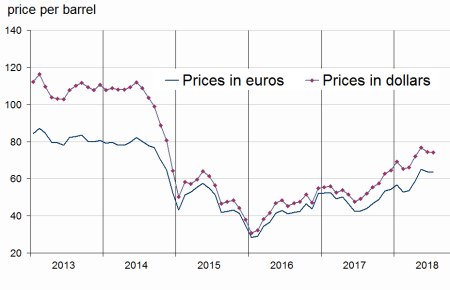
- Source: INSEE
Pour en savoir plus
Time series : Raw materials prices