

 27 July 2018
2018- n° 205In June 2018, agricultural prices increased slightly over one year (+0,2%) Indices of agricultural prices - June 2018
27 July 2018
2018- n° 205In June 2018, agricultural prices increased slightly over one year (+0,2%) Indices of agricultural prices - June 2018
In June 2018, agricultural products prices prices rose by 0.2% over one year (after −0.4% in May). Excluding fruits and vegetables, they declined by 1.0% over one year and are stable over one month.
In June 2018, agricultural products prices prices rose by 0.2% over one year (after −0.4% in May). Excluding fruits and vegetables, they declined by 1.0% over one year and are stable over one month.
Cereals prices rose again
In June 2018, cereal prices went up by 3.1% over one month after +3.6% in May. Soft wheat prices accelerated: +6.3% after +3.8% in May. In June, wheat crops suffered from dry weather in the United States, Russia and Australia and from heavy rainfall in France. Grain maize prices fell back: −3.2% over one month after +1.9% in May. Trade tensions between the United States and China weighed on grain maize prices and on soybeans as well (−6.6% over one month after +2.3% in May). Overall, oilseed prices went down by 1.2% over one month and by 4.8% over one year.
graphiqueGraph1 – Producer prices of cereals
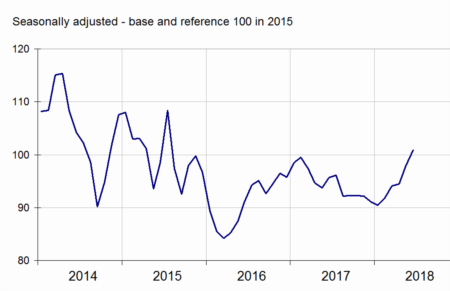
- Source: INSEE
Summer fruits prices went up over one year
In June 2018, fruit prices rose by 22.3% over one year. Especially, prices of summer fruits increased: strongly for apricots (+47.4% over one year), peaches and nectarines (+31.3%); moderatly for cherries (+ 5.0%). Vegetable prices decreased by 0.4% over one year. Tomatoes prices fell in June (−29.5% over one year) while those for salad went up (+22.1%). At the beginning of their marketing period, melon prices grew slightly (+ 2.3% over one year).
graphiqueGraph2 – Producer prices of fresh vegetables
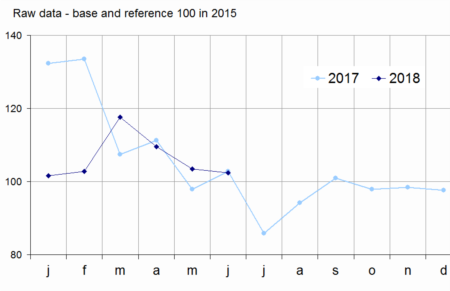
- Source: SSP (ministry in charge of agriculture)
Animal prices fell back
In June 2018, animal prices went down by 0.6% over one month after +0.5% in May. Over one year, they decreased by 4.1%. Pigs prices resumed their decline: −3.3% over one month after +0.4% in May and −6.7% in April, due to new imbalances between supply and demand. Cattle prices were almost stable over one month (-0.1% after + 0.5%).
graphiqueGraph3 – Producer prices of pigs and large cattle
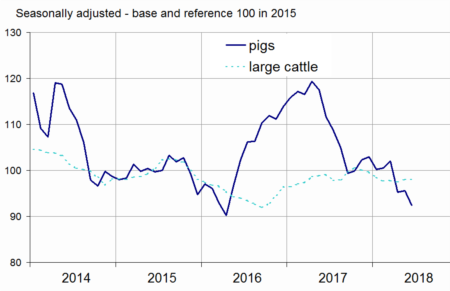
- Source: INSEE
Egg prices rebounded slightly
In June 2018, eggs price went up by 4.3% after two months of sharp decline (−27.9% in May, −20.7% in April) at the end of the fipronil crisis. They were still down markedly over one year (−11.8%). The price of cow's milk remained on the rise over one year (+0.9% in May after +0.4% in April).
tableautable1 – Index of producer prices of agricultural products (IPPAP)
| Variation as % over | |||||
|---|---|---|---|---|---|
| Weights | May 2018 | a month | 3 months | a year | |
| Agricultural goods output | 1000 | 103.5 | /// | /// | +0.2 |
| excluding fruits and vegetables | 906 | 102.9 | 0.0 | –0.4 | –1.0 |
| Crop output (excluding fruits and vegetables) | 489 | 105.5 | +0.2 | +2.2 | +0.6 |
| Cereals | 152 | 100.9 | +3.1 | +7.2 | +5.4 |
| of which soft wheat | 90 | 102.8 | +6.3 | +11.1 | +7.1 |
| grain maize | 27 | 100.1 | –3.2 | +0.1 | –3.2 |
| Potatoes | 29 | 126.4 | /// | /// | –22.6 |
| Wines | 200 | 110.6 | –1.1 | –0.6 | +5.1 |
| PDO wines | 112 | 119.4 | –2.0 | –1.1 | +7.2 |
| other wines | 25 | 95.6 | +0.7 | –0.5 | +7.5 |
| Oleaginous | 40 | 89.6 | –1.2 | +0.1 | –4.8 |
| Horticultural products | 35 | 102.0 | +1.0 | –1.5 | 0.0 |
| Other crop products | 33 | 99.4 | 0.0 | +0.2 | –5.2 |
| Fruits and vegetables (1) | 94 | 107.8 | /// | /// | +9.0 |
| Fresh vegetables | 45 | 102.4 | /// | /// | –0.4 |
| Fresh fruits | 32 | 110.2 | /// | /// | +22.3 |
| Animal output | 417 | 99.9 | –0.2 | –3.3 | –2.8 |
| Animals | 255 | 97.4 | –0.6 | –1.7 | –4.1 |
| of which large cattle | 112 | 97.9 | –0.1 | +0.1 | –1.2 |
| calves | 20 | 100.5 | –0.8 | –0.2 | +0.8 |
| pigs | 49 | 92.4 | –3.3 | –9.4 | –17.3 |
| sheep | 14 | 102.1 | +0.6 | –1.8 | +0.3 |
| poultry | 57 | 97.5 | +0.4 | +0.3 | –1.1 |
| of which chicken | 39 | 97.3 | +0.4 | +0.3 | –1.3 |
| Milk | 146 | 104.9 | /// | +0.2 | +0.5 |
| of which cow milk (2) | 135 | 105.1 | /// | –0.1 | +0.5 |
| Eggs | 16 | 94.1 | +4.3 | –40.4 | –11.8 |
- /// Absence of meaning due to the nature of these series
- (1) Including vegetables for industry.
- (2) The May value of cow milk price index is the estimate of the June one. The previous month variation is the one commented in the text: +0,9% over one year in May 2018.
- Sources: INSEE, SSP (ministry in charge of agriculture)
Purchase prices of means of production almost unchanged over one month
In June 2018, purchase prices of the means of production decreased slightly (−0.2%). The slight decline in energy prices (−0.8%) and the further fall in fertilizers and amendments prices (−1.0%) were partially offset by the slight increase in animal feeds prices (+0.2%). Over one year, intermediate consumption prices accelerated (+4.0% after +3.2%) in the wake of energy prices (+24.3%).
Prices of capital goods were virtually stable over one month (+0.1%) and up 3.2% over one year.
Revision
The variation over one year of IPPAP has been rosen by 0.1 points in April to −0,4%; The one of IPAMPA is unchanged.
graphiqueGraph4 – Purchase prices of the means of agricultural production
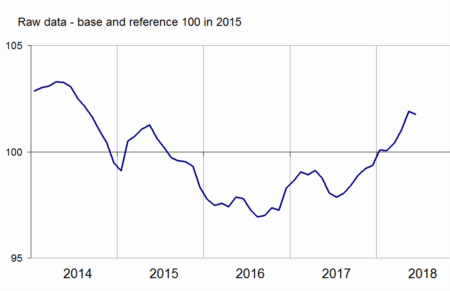
- Sources: INSEE, SSP (ministry in charge of agriculture)
tableautable2 – Indices of purchase prices of the means of agricultural production (IPAMPA)
| Variation as % over | |||||
|---|---|---|---|---|---|
| Weights | May 2018 | a month | 3 months | a year | |
| Total input | 1000 | 101.8 | –0.1 | +1.4 | +3.8 |
| Intermediate consumptions | 760 | 100.4 | –0.2 | +1.6 | +4.0 |
| Energy | 93 | 118.3 | –0.8 | +8.5 | +24.3 |
| Seeds | 56 | 97.2 | –0.1 | +0.2 | 0.0 |
| Fertilisers and soil improvers | 107 | 86.9 | –1.0 | –1.4 | +2.8 |
| Plant protection products | 84 | 99.7 | –0.2 | +1.1 | +0.8 |
| Animal feed | 214 | 97.0 | +0.2 | +1.4 | +0.6 |
| Veterinary expenses | 37 | 106.6 | 0.0 | +0.2 | +2.0 |
| Small equipment and tools | 11 | 100.2 | +0.5 | –1.7 | +0.9 |
| Maintenance of materials | 88 | 104.8 | +0.1 | +0.5 | +2.5 |
| Maintenance of buildings | 9 | 104.7 | 0.0 | +0.4 | +2.1 |
| Other goods and services | 61 | 101.4 | 0.0 | +0.1 | –0.2 |
| Goods and services contributing to investment | 240 | 106.2 | +0.1 | +0.9 | +3.2 |
| Material | 168 | 105.5 | 0.0 | +1.1 | +2.4 |
| Tractors | 71 | 109.0 | –0.1 | +1.8 | +3.6 |
| Machinery and equipment for cultivation | 33 | 104.8 | +0.4 | +1.0 | +2.3 |
| Machinery and equipment for harvesting | 38 | 102.8 | –0.1 | +0.3 | +1.1 |
| Utility vehicles | 16 | 99.6 | +0.2 | +0.3 | 0.0 |
| Buildings | 72 | 107.6 | 0.0 | +0.1 | +4.8 |
- (1) The repayment of the domestic tax on energy product (TICPE) benefiting farmers has been applied in advance for the year 2018.
- Sources: INSEE, SSP (ministry in charge of agriculture)
Pour en savoir plus
Time series : Indices of agricultural prices