

 25 July 2018
2018- n° 195In July 2018, the economic climate improves sharply in civil engineering Quaterly survey of public works - July 2018
25 July 2018
2018- n° 195In July 2018, the economic climate improves sharply in civil engineering Quaterly survey of public works - July 2018
According to the business managers surveyed in July 2018, the economic climate in civil engineering has improved sharply. The civil engineering professionals are confident: all the balances of opinion stand well above their long-term average.
According to the business managers surveyed in July 2018, the economic climate in civil engineering has improved sharply. The civil engineering professionals are confident: all the balances of opinion stand well above their long-term average.
Business managers' opinion on their past activity improves
In July 2018, more business managers than in April have indicated an increase in their activity over the past three months, mainly due to public-sector projects. After a fall in April, probably in connection with unfavourable weather conditions in the first quarter of 2018, the corresponding balance of opinion has picked up and has almost returned to its level hit at the beginning of the year, far above its long-term average. Otherwise, as many business managers as in April forecast an increase in their activity over the next three months. The corresponding balance is virtually stable for both types of customers, public sector and private sector, and remains in both cases well above its long-term average. Furthermore, business managers deem that their order books are more filled; the corresponding balance of opinion has advanced and has exceeded more largely its long-term average.
Lack of workforce is more felt
In July 2018, obstacles to production due to workforce shortage have intensified. Indeed, 51% of businesses have indicated being hampered because of workforce shortage, the highest proportion since April 2001 and well above its long-term average (15%).
Employment prospects improve again sharply
Slightly more business managers than in April 2018 plan to increase their workforce in the next few months. The corresponding balance has increased again and stands far above its long-term average.
tableauTable1 – Public works economic outlook
| Mean* | Oct. 17 | Jan. 18 | April 18 | July 18 | |
|---|---|---|---|---|---|
| Past activity | –6 | 32 | 37 | 23 | 35 |
| - public-sector project | –12 | 20 | 23 | 14 | 29 |
| - private-sector project | –10 | 28 | 32 | 24 | 25 |
| Expected activity | –13 | 36 | 21 | 29 | 29 |
| - public-sector project | –17 | 23 | 17 | 22 | 23 |
| - private-sector project | –16 | 29 | 16 | 24 | 22 |
| Opinion on order books | –26 | 11 | 14 | 10 | 19 |
| Obstacles to production increase because of workforce shortage (in %) | 15 | 35 | 40 | 38 | 51 |
| Expected workforce | –14 | 37 | 29 | 31 | 33 |
- Note: the balances of opinion by costumer may differ from the balance of the whole, because sometimes the firms don't distinguish public-sector project and private-sector project.
- * Mean since January 1981
- Sources: FNTP and INSEE
graphiqueGraph1 – Activity tendency in civil engineering
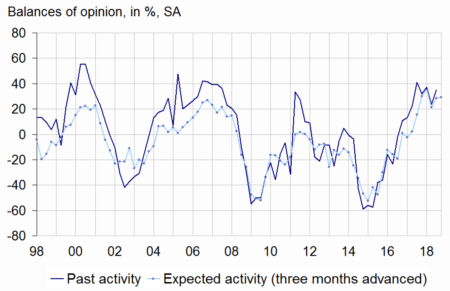
- Sources: FNTP and INSEE