

 24 July 2018
2018- n° 189In July 2018, the business climate slightly improves in retail trade and in trade
and repair of motor vehicles Monthly survey of retailing - July 2018
24 July 2018
2018- n° 189In July 2018, the business climate slightly improves in retail trade and in trade
and repair of motor vehicles Monthly survey of retailing - July 2018
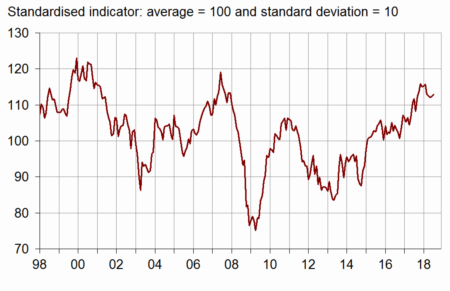
According to the managers in retail trade and in trade and repair of motor vehicles, the business climate remains favourable in July 2018. The composite indicator that measures it has gained one point, to 113. It remains well above its long-term average (100), that it has reached or exceeded since February 2015.

Warning: the seasonal components have been updated in July 2018, as well as the parameters of the three composite indicators, which leads to slight revisions. They are updated once a year.
According to the managers in retail trade and in trade and repair of motor vehicles, the business climate remains favourable in July 2018. The composite indicator that measures it has gained one point, to 113. It remains well above its long-term average (100), that it has reached or exceeded since February 2015.
graphiqueChart_1 – Business climate synthetic indicator
A past activity deemed on the rise
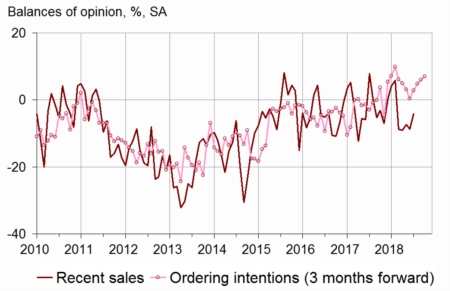
More managers than in June have declared a rise in their recent sales. The corresponding balance has moved above its average. About the next three months, the managers' opinions remain divided: the balance concerning expected sales has increased, reaching its highest point for more than ten years, the one about ordering intentions is practically stable, while the one on general business outlook has continued to decline. Each of those three balances remains above its long-term average.
Slightly more managers than on the last interrogation have indicated increases in prices on the last as on the next months. The corresponding balances stand above their mean level.
The cash-flow situation has been estimated slightly less easy than in May, the corresponding balance coming closer to its average.
tableauTable_1 – Tendency in retail trade and in trade and repair of motor vehicles
| Ave. (1) | April 18 | May 18 | June 18 | July 18 | |
|---|---|---|---|---|---|
| Business climate | 100 | 112 | 112 | 112 | 113 |
| General business outlook | –28 | –4 | –4 | –8 | –9 |
| Recent sales | –6 | –9 | –7 | –9 | –4 |
| Expected sales | –2 | 6 | 9 | 11 | 15 |
| Ordering intentions | –7 | 3 | 5 | 6 | 7 |
| Stocks | 11 | 15 | 15 | 14 | 14 |
| Past selling prices (2) | –6 | –2 | 0 | ||
| Expected selling prices | –3 | –2 | –3 | –5 | 0 |
| Cash position (2) | –15 | –12 | –14 | ||
| Workforce size: recent trend | 1 | 4 | 4 | 3 | 3 |
| Workforce size: future trend | –3 | 1 | –1 | 2 | 2 |
- (1) Average since 1991 (2004 for recent and expected sales and ordering intentions).
- (2) Bi-monthly question (odd-numbered months).
- Source: INSEE - monthly survey in retail trade and in trade and repair of motor vehicles
graphiqueChart_2 – Recent sales and ordering intentions
Stability in the opinion about employment in retail trade
The balances of opinion on past as on expected employment are stable, due to retail trade. In that latter sector, the balance on past workforce stands at its average while the one about expected workforce stands above it. In trade and repair of motor vehicles, these balances have barely changed, standing at very high levels.
In retail trade, the business climate is stable
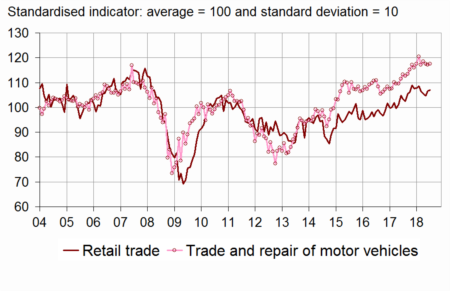
In retail trade, the business climate is stable. In July, the composite indicator that measures it remains at 107, above its average (100) since May 2017.
Slightly more non-specialised retailers than in June have indicated a fall in their past sales while it is the opposite in specialised trade. The corresponding balances remain below their mean level.
Overall, the balance of opinion about expected sales has risen for three months. The balances concerning ordering intentions and general business outlook are practically stable. Each of the three remains above its average.
More retailers than on the last interrogation have indicated an increase in their past and expected prices. The corresponding balances stand above their mean level.
The cash-flow position has been estimated as easy as in May, the balance remaining close to its average.
In trade and repair of motor vehicles, the business climate is practically stable at a very high level
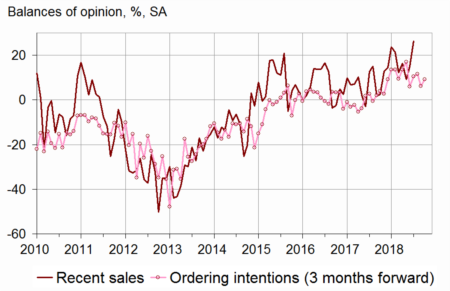
In trade and repair of motor vehicles and motor cycles, the business climate, practically stable, stands at a very high level (118). It has been above its average (100) since January 2015.
The balances concerning recent sales and ordering intentions have increased, the one on expected sales is almost unchanged and the one about general business outlook has slightly fallen. Each of these four balances remains well above its average.
The balances on prices for the past and the next months have moderately risen, staying above their average. The cash situation is estimated less easy than in May, the corresponding balance remaining above its mean level.
graphiqueChart_3 – Recent sales and ordering intentions in trade and repair of motor vehicles
graphiqueChart_4 – Business climate synthetic indicator in retail trade and in trade and repair of motor vehicles
tableauTable_2 – Detailed data
| Ave. (1) | April 18 | May 18 | June 18 | July 18 | |
|---|---|---|---|---|---|
| Retail trade - Global data | |||||
| Business climate | 100 | 106 | 105 | 107 | 107 |
| Gener. busin. outlook | –29 | –6 | –7 | –12 | –11 |
| Recent sales | –6 | –20 | –15 | –19 | –18 |
| Expected sales | 0 | 3 | 6 | 8 | 14 |
| Ordering intentions | –6 | 0 | 2 | 6 | 5 |
| Stocks | 10 | 11 | 15 | 12 | 12 |
| Past selling prices (2) | –8 | –5 | –3 | ||
| Expected selling prices | –5 | –6 | –6 | –8 | –2 |
| Cash position (2) | –13 | –12 | –12 | ||
| Workforce size: recent trend | 2 | 4 | 3 | 2 | 2 |
| Workforce size: future trend | –2 | –1 | –3 | 1 | 1 |
| Non-specialised retail trade | |||||
| Recent sales | –2 | –20 | –12 | –18 | –20 |
| Expected sales | 7 | 6 | 7 | 17 | 26 |
| Ordering intentions | 2 | 1 | 10 | 17 | 19 |
| Stocks | 7 | 9 | 12 | 7 | 6 |
| Past selling prices (2) | –8 | –5 | 2 | ||
| Expected selling prices | –5 | –1 | 1 | –6 | 1 |
| Cash position (2) | –7 | –7 | –7 | ||
| Specialised retail trade | |||||
| Recent sales | –12 | –20 | –17 | –21 | –16 |
| Expected sales | –8 | –1 | 3 | –2 | –2 |
| Ordering intentions | –16 | –3 | –8 | –8 | –11 |
| Stocks | 13 | 13 | 18 | 18 | 17 |
| Past selling prices (2) | –8 | –6 | –8 | ||
| Expected selling prices | –5 | –11 | –13 | –10 | –6 |
| Cash position (2) | –22 | –17 | –18 | ||
| Trade and repair of motor cars and motorcycles | |||||
| Business climate | 100 | 118 | 117 | 117 | 118 |
| Gener. busin. outlook | –26 | 9 | 4 | 5 | –1 |
| Recent sales | –6 | 16 | 9 | 15 | 26 |
| Expected sales | –5 | 9 | 14 | 17 | 18 |
| Ordering intentions | –10 | 11 | 12 | 6 | 9 |
| Stocks | 15 | 23 | 16 | 18 | 21 |
| Past selling prices (2) | 1 | 5 | 6 | ||
| Expected selling prices | 4 | 7 | 6 | 5 | 7 |
| Cash position (2) | –23 | –13 | –18 | ||
| Workforce size: recent trend | –8 | 2 | 9 | 12 | 10 |
| Workforce size: future trend | –6 | 11 | 9 | 8 | 7 |
- (1) Average since 1991 (2003 for trade and repair of motor vehicles and 2004 for recent and expected sales and ordering intentions).
- (2) Bi-monthly question (odd-numbered months).
- Source: INSEE - monthly survey in retail trade and in trade and repair of motor vehicles
Documentation
Methodology (pdf,129 Ko)