

 29 June 2018
2018- n° 178In May 2018, agricultural prices went down by 0.5% over one year Indices of agricultural prices - May 2018
29 June 2018
2018- n° 178In May 2018, agricultural prices went down by 0.5% over one year Indices of agricultural prices - May 2018
In May 2018, agricultural products prices decreased by 0.5% over one year (after −1.3% in April). Excluding fruits and vegetables, they declined by 1.1% over one year but went up by 0.7% over one month.
In May 2018, agricultural products prices decreased by 0.5% over one year (after −1.3% in April). Excluding fruits and vegetables, they declined by 1.1% over one year but went up by 0.7% over one month.
Cereals prices accelerated
In May 2018, cereal prices rose by 3.6% over one month, after +0.4% in April. They benefited from Euro fall against the US dollar. Soft wheat prices increased by 3.8% after +0.8% in April. Concerns over the weather have shifted to the Black Sea due to excessive rainfall. Grain maize prices increased also (+1.9% over one month after +1.5% in April), supported by drought in the United States and Brazil. Oilseeds rebounded (+2.0% after −0.7%). In France, May thunderstorms drew worries about rapeseed yields, what boosted their prices (+2.3% in May after −1.0% in April).
graphiqueGraph1 – Producer prices of cereals
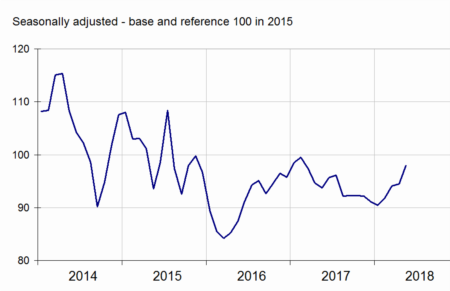
- Source: INSEE
Prices rose for fruits and vegetables
In May 2018, fruit prices went up by 9.7% over one year. In late season, apples had their prices increasing sharply (+31.3% year on year). The prices of strawberries, seasonal fruit, grew by 2.8% over one year while the arrival of cherries was made with a slight decrease in prices (−1.8%). Vegetable prices rose by 5.7% over one year, driven by tomatoes (+18.5%), salad (+15.3%) and cucumbers (+57.6%). On the other hand, prices went down for endives (−16.3% over one year) and asparagus (−17.6%).
graphiqueGraph2 – Producer prices of fresh vegetables
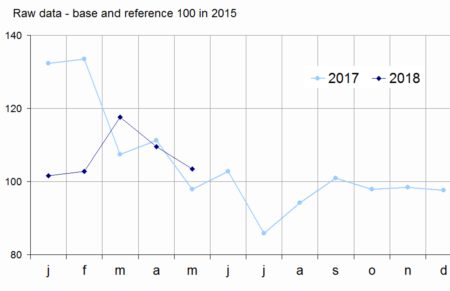
- Source: SSP (ministry in charge of agriculture)
Animal prices: slight increase over one month
In May 2018, animal prices rebounded slightly over a month (+0.5% after −1.6% in April). Over one year, they were still down by 4.2%. Pork prices rose by 0.4% over one month after falling by 6.7% in April. A return of domestic demand has allowed a better balance with supply. Prices for cattle went up 0.5% over one month, following a decline of 0.3% in April.
graphiqueGraph3 – Producer prices of pigs and large cattle
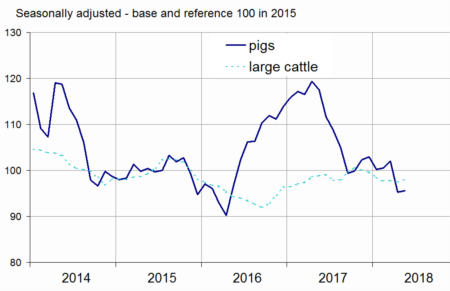
- Source: INSEE
Further drop of egg prices
In May 2018, eggs prices declined by 27.9% over one month after −20.7% in April. Their prices have fallen by 56.2% since their December 2017 peak, a consequence of the fipronil crisis. The price of cow's milk slowed down again over one year (+0.4% in April after +2.1% in March).
tableautable1 – Index of producer prices of agricultural products (IPPAP)
| Variation as % over | |||||
|---|---|---|---|---|---|
| Weights | May 2018 | a month | 3 months | a year | |
| Agricultural goods output | 1000 | 103.2 | /// | /// | –0.5 |
| excluding fruits and vegetables | 906 | 102.8 | +0.7 | –0.2 | –1.1 |
| Crop output (excluding fruits and vegetables) | 489 | 105.3 | +2.0 | +2.5 | +0.7 |
| Cereals | 152 | 97.9 | +3.6 | +6.5 | +4.5 |
| of which soft wheat | 90 | 96.7 | +3.8 | +6.3 | +5.0 |
| grain maize | 27 | 103.4 | +1.9 | +9.1 | –1.7 |
| Potatoes | 29 | 130.2 | /// | /// | –23.3 |
| Wines | 200 | 111.8 | +0.3 | +0.3 | +6.7 |
| PDO wines | 112 | 121.8 | +1.6 | +0.3 | +9.4 |
| other wines | 25 | 94.9 | –5.6 | +0.6 | +9.8 |
| Oleaginous | 40 | 90.7 | +2.0 | +2.0 | –6.1 |
| Horticultural products | 35 | 100.6 | +1.2 | –3.7 | –2.0 |
| Other crop products | 33 | 99.4 | +0.2 | +0.2 | –5.4 |
| Fruits and vegetables (1) | 94 | 107.8 | /// | /// | +5.4 |
| Fresh vegetables | 45 | 103.5 | /// | /// | +5.7 |
| Fresh fruits | 32 | 116.6 | /// | /// | +9.7 |
| Animal output | 417 | 99.8 | –1.1 | –3.4 | –3.2 |
| Animals | 255 | 98.0 | +0.5 | –0.7 | –4.2 |
| of which large cattle | 112 | 98.0 | +0.5 | +0.4 | –0.8 |
| calves | 20 | 101.3 | +0.5 | +1.1 | +1.4 |
| pigs | 49 | 95.6 | +0.4 | –4.9 | –18.6 |
| sheep | 14 | 101.5 | +1.5 | +0.6 | +3.3 |
| poultry | 57 | 97.1 | –0.1 | –0.5 | –1.0 |
| of which chicken | 39 | 96.9 | –0.1 | –0.5 | –0.9 |
| Milk | 146 | 104.1 | /// | –0.9 | +0.1 |
| of which cow milk (2) | 135 | 104.4 | /// | –0.9 | +0.2 |
| Eggs | 16 | 90.2 | –27.9 | –43.9 | –15.5 |
- * cf. methodological note
- /// Absence of meaning due to the nature of these series
- (1) Including vegetables for industry.
- (2) The April value of cow milk price index is the estimate of the May one. The previous month variation is the one commented in the text: +0,4% over one year in April 2018.
- Sources: INSEE, SSP (ministry in charge of agriculture)
Acceleration of the purchase prices of means of production
In May 2018, purchase prices of the means of production rose by 3.2% over one year (after +2.0% in April). Oil prices recent increases have contributed significantly to this acceleration. Over one month, energy prices increased by 5.5% after +3.8% in April. For other intermediate consumption, the variations over one month are more limited: +0.6% for animal feeds and +0.4% for crop protection. The prices of fertilizers and amendments are down over one month (−0.5%). Prices for capital goods rose 0.8% over one month and 3.2% over one year.
Revision
The variation over one year of IPPAP has been reduced by 0.1 points in April to −1,3 %; The one of IPAMPA has been rosen by 0.1 points to +2,0 %.
graphiqueGraph4 – Purchase prices of the means of agricultural production
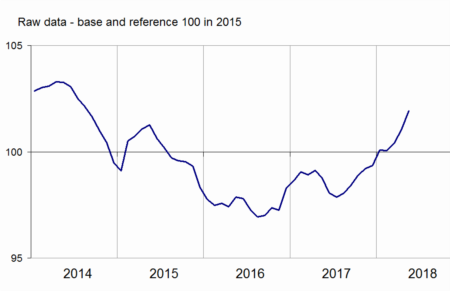
- Sources: INSEE, SSP (ministry in charge of agriculture)
tableautable2 – Indices of purchase prices of the means of agricultural production (IPAMPA)
| Variation as % over | |||||
|---|---|---|---|---|---|
| Weights | May 2018 | a month | 3 months | a year | |
| Total input | 1000 | 101.9 | +0.8 | +1.8 | +3.2 |
| Intermediate consumptions | 760 | 100.6 | +0.9 | +2.1 | +3.2 |
| Energy | 93 | 119.3 | +5.5 | +10.0 | +20.1 |
| Seeds | 56 | 97.5 | +0.1 | +0.6 | +0.1 |
| Fertilisers and soil improvers | 107 | 87.8 | –0.5 | 0.0 | +0.2 |
| Plant protection products | 84 | 99.9 | +0.4 | +1.6 | +1.0 |
| Animal feed | 214 | 96.9 | +0.6 | +1.8 | +0.3 |
| Veterinary expenses | 37 | 107.3 | 0.0 | +1.1 | +2.9 |
| Small equipment and tools | 11 | 99.8 | –1.5 | +0.3 | +0.4 |
| Maintenance of materials | 88 | 104.7 | +0.2 | +0.6 | +2.6 |
| Maintenance of buildings | 9 | 104.3 | 0.0 | +0.3 | +1.9 |
| Other goods and services | 61 | 101.4 | 0.0 | +0.1 | –0.2 |
| Goods and services contributing to investment | 240 | 106.1 | +0.8 | +1.0 | +3.2 |
| Material | 168 | 105.5 | +1.1 | +1.1 | +2.5 |
| Tractors | 71 | 109.1 | +2.2 | +1.7 | +3.9 |
| Machinery and equipment for cultivation | 33 | 104.4 | +0.7 | +0.6 | +2.0 |
| Machinery and equipment for harvesting | 38 | 102.9 | 0.0 | +0.5 | +1.1 |
| Utility vehicles | 16 | 99.4 | +0.1 | +0.6 | –0.1 |
| Buildings | 72 | 107.5 | 0.0 | +1.1 | +5.0 |
- (1) The repayment of the domestic tax on energy product (TICPE) benefiting farmers has been applied in advance for the year 2018.
- Sources: INSEE, SSP (ministry in charge of agriculture)
Pour en savoir plus
Time series : Indices of agricultural prices