

 26 June 2018
2018- n° 163In Q1 2018, producer costs for construction increased (+0.8%) Costs of production indices in construction - first quarter 2018
26 June 2018
2018- n° 163In Q1 2018, producer costs for construction increased (+0.8%) Costs of production indices in construction - first quarter 2018
In Q1 2018, producer costs for construction slightly slowed down (+0.8% after +1.1% in the previous quarter). They increased in all sub-sectors but less significantly than in the previous quarter: +1.4% (after +1.8%) in civil engineering, +0.7% (after +1.0%) in building construction as well as in specialised construction works. Over a year, these costs decelerated too (+2.4% after +2.7% in Q4 2017), in civil engineering (+2.7% after +4.0%) as well as in building construction (+2.4% after +2.7%) and in specialised construction works (+2.3% after +2.5%).

Avertissement: in accordance with the European directives, producer costs for construction are broadcast in reference 100 in 2015 from this release. Additional information related to this change are available on the Web page of these indicators (flag: Documentation).
In Q1 2018, producer costs for construction slightly slowed down (+0.8% after +1.1% in the previous quarter). They increased in all sub-sectors but less significantly than in the previous quarter: +1.4% (after +1.8%) in civil engineering, +0.7% (after +1.0%) in building construction as well as in specialised construction works. Over a year, these costs decelerated too (+2.4% after +2.7% in Q4 2017), in civil engineering (+2.7% after +4.0%) as well as in building construction (+2.4% after +2.7%) and in specialised construction works (+2.3% after +2.5%).
Materials cost increased
In Q1 2018, the cost of materials increased in the three sectors: in building construction (+1.3% after +1.2%), in civil engineering (+1.6% after a stability) and in specialised works for civil engineering (+1.3% after +0.8%).
Over a year, materials cost remained dynamic, notably in civil engineering (+3.5% after +7.1%) and in building construction (+3.3% as in Q4 2017).
Energy cost accelerated remarkly
In Q1 2018, the cost of energy increased remarkly in building construction (+9.0% after +5.7%) and in public works (+9.2% after +6.4%) due to a large acceleration in prices of fuel oil and gas oil.
Over a year, the rise in the cost of energy was significant too (+8.9% after +8.1% in public works and +9.3% after +9.4% in building construction).
tableauTable1 – Variations in producer cost indices for construction
| Heading | Weights (in %) | Q1 2018/ Q4 2017 | Q1 2018/ Q1 2017 |
|---|---|---|---|
| F Construction | 100.0 | +0.8 | +2.4 |
| 41.2 Construction of buildings | 10.2 | +0.7 | +2.4 |
| 42 Civil engineering | 15.9 | +1.4 | +2.7 |
| 43 Specialised construction works | 73.9 | +0.7 | +2.3 |
| 43BT Buildings | 65.2 | +0.6 | +2.3 |
| 43BTC New buildings | 24.7 | +0.8 | +2.5 |
| 43BTR Existing buildings | 40.5 | +0.6 | +2.2 |
| 43TP Specialised works for civil engineering | 8.7 | +1.2 | +2.2 |
| Buildings (41.2 + 43BT) | 75.4 | +0.6 | +2.3 |
| Public works (42 + 43TP) | 24.6 | +1.3 | +2.5 |
- Source: INSEE
tableauTable2 – Items of producer cost indices for construction
| Costs | items | Q1 2018/ Q4 2017 | Q1 2018/ Q1 2017g |
|---|---|---|---|
| Equipment | Buildings | +0.2 | −0.2 |
| Public works | +0.3 | 0.0 | |
| Labour | Labour costs in construction | -0.4 | +1.8 |
| Energy | Buildings | +9.0 | +9.3 |
| Public works | +9.2 | +8.9 | |
| Materials | Construction of buildings | +1.3 | +3.3 |
| Existing buildings | +1.0 | +2.4 | |
| Civil engineering | +1.6 | +3.5 | |
| Specialised works for civil engineering | +1.3 | +2.3 |
- Source: INSEE
graphiqueGraph1 – Production costs in construction
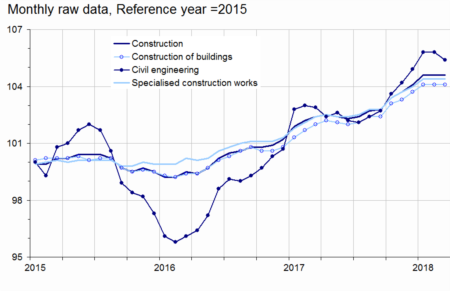
- Source: INSEE
Equipment cost slightly increased in building construction and in public works
In Q1 2018, equipment cost slightly increased in building construction (+0.2% after +0.1%) but it slightly declined by 0.2% yoy (after −0.8%). In public works, it rose too (+0.3% after +0.1% in Q4 2017) and it was stable over a year (after +0.4%).
graphiqueGraph2 – Materials cost
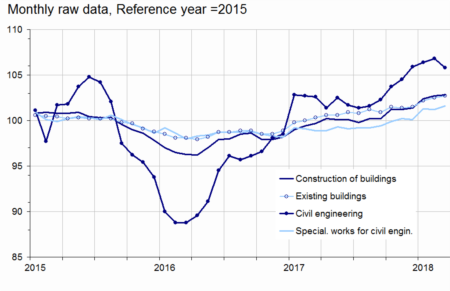
- Source: INSEE
graphiqueGraph3 – Equipment cost
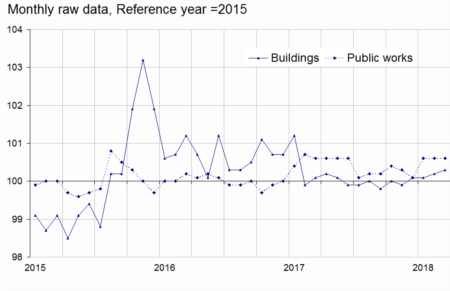
- Source: INSEE
graphiqueGraph4 – Energy cost
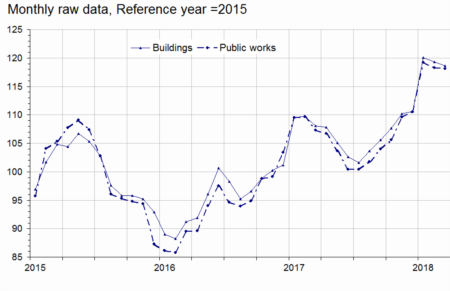
- Source: INSEE