

 2 July 2018
2018- n° 149Continuing rise in prices of second-hand dwellings in Q1 2018 Notaries-INSEE second-hand dwellings price index - first quarter 2018
2 July 2018
2018- n° 149Continuing rise in prices of second-hand dwellings in Q1 2018 Notaries-INSEE second-hand dwellings price index - first quarter 2018
2 July 2018: The file of additional data has been updated compared to the publication of 7 June 2018.
In Q1 2018, prices of second-hand dwellings were still increasing: +1.5% compared to the previous quarter (provisional seasonally adjusted results), after +0.3%. Contrary to observed since the end of 2016, the increase was more important for houses (+1.6%) than for flats (+1.4%).
Over a year, the rise of prices continued: +3.5% compared to Q1 2017, after +3.3% the quarter before. This increase was mainly due to flat prices, which increased by 4.3% over the year, against 2.9% for houses.
In Île-de-France, the rise of prices of second-hand dwellings pursued
In Q1 2018, prices of second-hand dwellings in Île-de-France continued to rise: +0.9% compared to Q4 2017, after +0.7%.
Year on year, prices were still increasing, but at a quite slower pace than observed the two quarters before: +4.3%, after +4.7% and +4.6%. The rise of the flat prices pursued, with a slight slowdown this quarter: +5.0% over a year, after +5.6% (+7.3% after +8.7% for flats in Paris). The annual rise in the house prices in Île-de-France, less strong, remained stable (+2.8% after +2.7%).
In provincial France, prices of second-hand dwellings also increased
In Q1 2018, the rise of prices of second-hand dwelling in provincial France increased by 1.8% compared to the previous quarter, after +0.2%.
Over one year, the prices increased less markedly than in Île-de-France: +3.1% between Q1 2017 and Q1 2018, after +2.6%. Like in Île-de-France, the annual rise was more important for flats (+3.5%) than for houses (+3.0%).
graphiqueGraphique1a – Variation in prices of second-hand dwellings in metropolitan France over a year
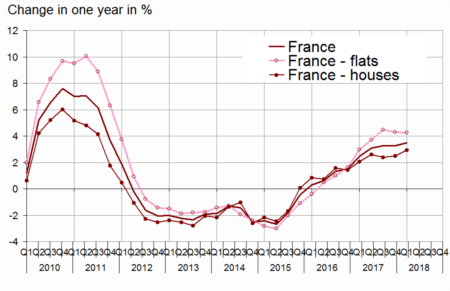
- Scope: Metropolitan France
- Sources: INSEE, French notaries - Database Bien, Perval society
graphiqueGraphique2a – Prices of second-hand dwellings in Île-de-France
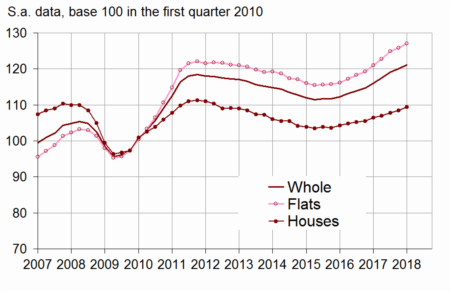
- Scope: Île-de-France
- Sources: INSEE, French notaries - Database Bien, Perval society
tableauTableau1a – Variation in prices of second-hand dwellings in metropolitan France
| change in | ||||||
|---|---|---|---|---|---|---|
| 3 months (S.A.) | 12 months | |||||
| 2017 Q3 | 2017 Q4 (sd) | 2018 Q1 (p) | 2017 Q3 | 2017 Q4 (sd) | 2018 Q1 (p) | |
| France | 0.9 | 0.3 | 1.5 | 3.3 | 3.3 | 3.5 |
| Flats | 1.2 | 0.4 | 1.4 | 4.5 | 4.3 | 4.3 |
| Houses | 0.7 | 0.3 | 1.6 | 2.4 | 2.5 | 2.9 |
- (p): provisional; (sd): semi-definitive
- Scope: Metropolitan France
- Sources: INSEE, French notaries - Database Bien, Perval society
The annual volume of transactions was stable in a high level
In Q1 2018, the annual volume of transactions was stable at a high level: in March, the number of transactions carried out over the last twelve months was 956,000. This volume was similar as the one recorded one quarter earlier (960,000 in December 2017), but remained higher than the one recorded one year earlier (877,000). Compared to the stock of available housing, which increases by around 1% per year, the proportion of transactions was equivalent to what was observed in the early 2000.
graphiqueGraphique3a – Volume of transactions of second-hand dwellings over the last 12 months
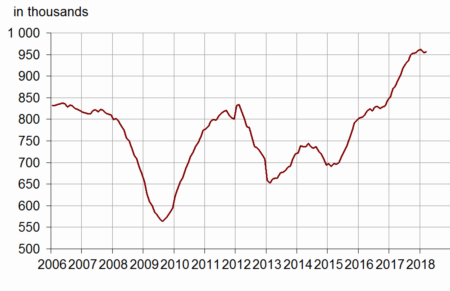
- Scope: France excluding Mayotte
- Sources: CGEDD, based on notarial databases and DGFiP (MEDOC)
Revisions
The second-hand housing price index is revised to include observations recorded after the previous publication. In comparison with the results released on 3 April 2018, the change in prices in Q4 2017 has been revised downwards by −0.2 points overall (−0.3 points for flats, no revision for houses). The overall change in prices in Q4 2017 stands at +0.3% compared to Q3 2017, instead of +0.5% (figure updated on 3 April 2018) and +1.0% estimated on 22 February 2018.
tableauTableau2a – Variation in prices of second-hand dwellings in metropolitan France
| Change in | ||||||
|---|---|---|---|---|---|---|
| 3 months (S.A.) | 12 months | |||||
| 2017 Q3 | 2017 Q4 (sd) | 2018 Q1 (p) | 2017 Q3 | 2017 Q4 (sd) | 2018 Q1 (p) | |
| Metropolitan France | 0.9 | 0.3 | 1.5 | 3.3 | 3.3 | 3.5 |
| - Flats | 1.2 | 0.4 | 1.4 | 4.5 | 4.3 | 4.3 |
| - Houses | 0.7 | 0.3 | 1.6 | 2.4 | 2.5 | 2.9 |
| Île-de-France | 1.4 | 0.7 | 0.9 | 4.6 | 4.7 | 4.3 |
| Provincial France | 0.7 | 0.2 | 1.8 | 2.7 | 2.6 | 3.1 |
| Flats | ||||||
| Île-de-France | 1.8 | 0.7 | 0.9 | 5.6 | 5.6 | 5.0 |
| - Paris | 2.1 | 2.2 | 0.3 | 7.8 | 8.7 | 7.3 |
| - Seine-et-Marne | -0.1 | 0.1 | 0.2 | 1.3 | 0.9 | -0.7 |
| - Yvelines | 1.1 | -0.1 | 1.2 | 2.7 | 1.9 | 2.7 |
| - Essonne | 0.1 | -0.2 | 1.0 | 0.8 | 0.5 | 0.1 |
| - Hauts-de-Seine | 2.0 | -0.6 | 2.0 | 5.3 | 4.3 | 4.8 |
| - Seine-Saint-Denis | 2.0 | -1.0 | 2.0 | 4.1 | 3.5 | 3.4 |
| - Val-de-Marne | 1.7 | -0.8 | 1.7 | 4.2 | 3.2 | 3.2 |
| - Val-d'Oise | 0.2 | 0.0 | 0.5 | 1.1 | 0.4 | 0.0 |
| Provincial France | 0.8 | 0.2 | 1.8 | 3.4 | 3.0 | 3.5 |
| - Conurbation > 10 000 inhabitants | 0.8 | 0.1 | ** | 3.6 | 3.1 | ** |
| - Central town | 0.7 | 0.7 | ** | 3.8 | 3.9 | ** |
| - Suburb | 1.0 | -0.8 | ** | 3.3 | 1.7 | ** |
| - Conurbation < 10 000 inhabitants | 0.4 | 0.4 | ** | 2.4 | 2.5 | ** |
| Houses | ||||||
| Île-de-France | 0.7 | 0.6 | 0.9 | 2.5 | 2.7 | 2.8 |
| - Seine-et-Marne | 1.0 | -0.1 | 1.9 | 2.5 | 2.1 | 3.0 |
| - Yvelines | 0.2 | 1.0 | 1.0 | 1.9 | 2.7 | 3.0 |
| - Essonne | 0.4 | 0.6 | 1.2 | 2.3 | 2.6 | 2.9 |
| - Hauts-de-Seine | 1.4 | 1.0 | -0.4 | 3.7 | 3.7 | 3.5 |
| - Seine-Saint-Denis | 1.1 | -0.3 | 0.7 | 3.3 | 2.9 | 2.3 |
| - Val-de-Marne | 0.7 | 0.9 | 0.1 | 2.8 | 3.4 | 2.5 |
| - Val-d'Oise | 0.6 | 0.5 | 0.8 | 1.8 | 2.4 | 2.0 |
| Provincial France | 0.7 | 0.2 | 1.7 | 2.4 | 2.4 | 3.0 |
| Nord-Pas de Calais | 0.0 | * | ** | 1.5 | * | ** |
| - Flats | 1.2 | * | ** | 4.1 | * | ** |
| - Houses | -0.3 | * | ** | 1.1 | * | ** |
| - Conurbation of Lille Houses | 0.6 | * | ** | 1.3 | * | ** |
| Provence-Alpes-Côte d'Azur | 1.4 | -0.8 | ** | 2.6 | 1.2 | ** |
| - Flats | 1.3 | -0.8 | ** | 2.6 | 0.8 | ** |
| - Houses | 1.4 | -0.9 | ** | 2.5 | 1.5 | ** |
| - Marseille Flats | 0.8 | 1.4 | ** | 2.7 | 5.3 | ** |
| Rhône-Alpes | 1.0 | 0.5 | ** | 2.7 | 3.0 | ** |
| - Flats | 0.7 | 0.3 | ** | 3.5 | 3.9 | ** |
| - Houses | 1.4 | 0.7 | ** | 2.0 | 2.2 | ** |
| - Lyon Flats | 2.0 | 2.3 | ** | 7.8 | 9.5 | ** |
- ** index released on 2 July 2018.
- * data for Q4 2017 about Nord-Pas-de-Calais could not be released here, because of an insufficient average rate in accordance with the criteria set out by the Scientific Board of the Notaires-INSEE indexes.
- (p): provisional ; (sd): semi-definitive
- Scope: Metropolitan France
- Sources: INSEE, French notaries - Database Bien, Perval society