

 31 May 2018
2018- n° 148In April 2018, agricultural prices went down by 1.2% over one year Indices of agricultural prices - April 2018
31 May 2018
2018- n° 148In April 2018, agricultural prices went down by 1.2% over one year Indices of agricultural prices - April 2018
In April 2018, agricultural products prices fell back by 1.2% over one year (after +0.2% in March). Excluding fruits and vegetables, prices decreased by 1.1% over one month and by 1.7% over one year (after −0.8%).
In April 2018, agricultural products prices fell back by 1.2% over one year (after +0.2% in March). Excluding fruits and vegetables, prices decreased by 1.1% over one month and by 1.7% over one year (after −0.8%).
Slight rise of cereals prices
In April 2018, cereal prices slowed (+0.4% after +2.4% in March). Soft wheat prices increased by 0.8% over one month after +1.6% in March and +2.1% in February. The end of the drought in the United States downturned prices from mid-April. Grain maize prices also decelerated to +1.5% after +5.5% because of the arrival of the rain in America. Oilseed prices headed back down: −0.7% in April after + 0.7% in March. The trend was reversed due to competition from Argentinean biodiesel and a drop in demand for palm oil from Malaysia.
graphiqueGraph1 – Producer prices of cereals
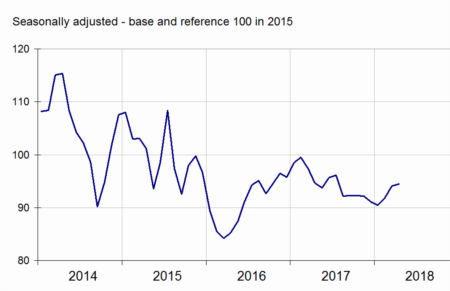
- Source: INSEE
Prices up for fruits, slightly down for vegetables
In April 2018, fruit prices increased by 20.4% over one year. The apple production deficit pushed their prices up again (+25.9% over one year), especially for golden apple (+40.0%). Vegetable prices slowed to −1.5% after +9.5% in March. Over one year trends showed mixed patterns. Prices for tomatoes were down by 21.0% and those for cauliflowers by 26.4%, while salad prices rose by 43.4% and those for asparagus by 32.1%.
graphiqueGraph2 – Producer prices of fresh vegetables
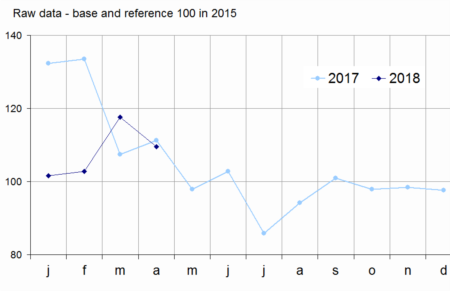
- Source: SSP (ministry in charge of agriculture)
Decline in Animal prices
In April 2018, animal prices decreased by 1.6% over one month and by 4.6% over one year. Pigs prices fell back over one month (−6.7% after +1.5% in March), accentuating the downward trend over one year (−20.2%). Increasing supply met fewer export opportunities, notably because of the Chinese pork production jump. Prices for cattle fell by 0.3% over one month and by 1.2% over one year.
graphiqueGraph3 – Producer prices of pigs and large cattle
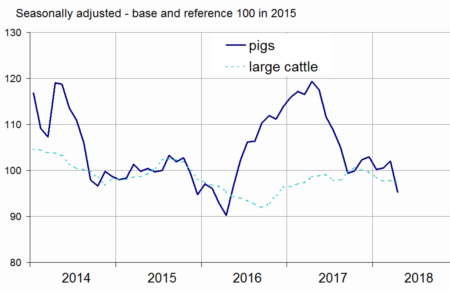
- Source: INSEE
Drop of egg prices
In April 2018, the price of eggs declined sharply (−20.7%) since the end of the fipronil crisis, losing 39.2% in 4 months. Over one year, it was still up by 10.5%. The rise of cow's milk prices slowed down over one year (+ 2.1% in March after + 3.8% in February).
tableautable1 – Index of producer prices of agricultural products (IPPAP)
| Variation as % over | |||||
|---|---|---|---|---|---|
| Weights | April 2018 | a month | 3 months | a year | |
| Agricultural goods output | 1000 | 102.6 | /// | /// | –1.2 |
| excluding fruits and vegetables | 906 | 102.2 | –1.1 | –0.7 | –1.7 |
| Crop output (excluding fruits and vegetables) | 489 | 103.1 | –0.1 | +1.0 | –1.4 |
| Cereals | 152 | 94.5 | +0.4 | +4.4 | –0.2 |
| of which soft wheat | 90 | 93.2 | +0.8 | +4.6 | –0.3 |
| grain maize | 27 | 101.5 | +1.5 | +6.8 | –4.4 |
| Potatoes | 29 | 121.2 | /// | /// | –30.0 |
| Wines | 200 | 111.2 | –0.1 | 0.0 | +7.9 |
| PDO wines | 112 | 119.5 | –1.0 | –1.2 | +11.2 |
| other wines | 25 | 100.5 | +4.6 | +6.6 | +12.4 |
| Oleaginous | 40 | 88.9 | –0.7 | –0.4 | –14.1 |
| Horticultural products | 35 | 99.3 | –4.2 | –4.1 | –2.6 |
| Other crop products | 33 | 99.2 | 0.0 | –0.1 | –5.6 |
| Fruits and vegetables (1) | 94 | 106.7 | /// | /// | +4.6 |
| Fresh vegetables | 45 | 109.5 | /// | /// | –1.5 |
| Fresh fruits | 32 | 122.3 | /// | /// | +20.4 |
| Animal output | 417 | 101.2 | –2.1 | –2.5 | –1.9 |
| Animals | 255 | 97.5 | –1.6 | –1.3 | –4.6 |
| of which large cattle | 112 | 97.5 | –0.3 | –1.0 | –1.2 |
| calves | 20 | 100.8 | +0.1 | +0.3 | +1.2 |
| pigs | 49 | 95.2 | –6.7 | –5.0 | –20.2 |
| sheep | 14 | 100.0 | –3.8 | +1.4 | +4.5 |
| poultry | 57 | 97.2 | 0.0 | –0.2 | –0.3 |
| of which chicken | 39 | 97.0 | 0.0 | –0.2 | 0.0 |
| Milk | 146 | 104.9 | /// | +0.7 | +1.1 |
| of which cow milk (2) | 135 | 105.2 | /// | +0.7 | +1.2 |
| Eggs | 16 | 125.1 | –20.7 | –30.5 | +10.5 |
- * cf. methodological note
- /// Absence of meaning due to the nature of these series
- (1) Including vegetables for industry.
- (2) The March value of cow milk price index is the estimate of the April one. The previous month variation is the one commented in the text: +2,1% over one year in March 2018.
- Sources: INSEE, SSP (ministry in charge of agriculture)
Increase in means of production purchase prices
In April 2018, purchase prices of means of production rose by 1.9% over one year. Intermediate consumption prices went up by 1.5% due to energy prices rise (+9.2% over one year). In contrast, the prices of fertilizers and amendments fell (−1.1%) and also those of animal feeds (−0.5%). Over a month, energy prices increase was sharp (+ 3.8%). It was less pronounced for animal feed (+ 0.5%).
Prices for capital goods are stable over one month and up 3.0% over one year.
Revision
The variation over one year of IPPAP has been reduced by 0.1 point in March to +0.2%; The variation over one year of IPAMPA is unchanged.
graphiqueGraph4 – Purchase prices of the means of agricultural production
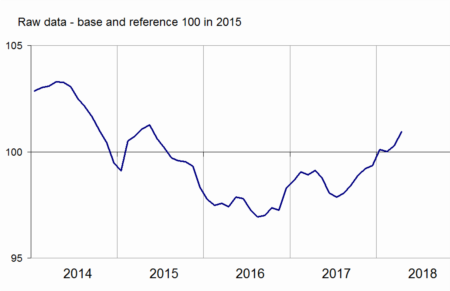
- Sources: INSEE, SSP (ministry in charge of agriculture)
tableautable2 – Indices of purchase prices of the means of agricultural production (IPAMPA)
| Variation as % over | |||||
|---|---|---|---|---|---|
| Weights | April 2018 | a month | 3 months | a year | |
| Total input | 1000 | 101.0 | +0.7 | +0.9 | +1.9 |
| Intermediate consumptions | 760 | 99.7 | +0.8 | +1.0 | +1.5 |
| Energy | 93 | 113.1 | +3.8 | +1.2 | +9.2 |
| Seeds | 56 | 97.5 | +0.4 | +0.8 | +0.2 |
| Fertilisers and soil improvers | 107 | 88.1 | –0.1 | +0.8 | –1.1 |
| Plant protection products | 84 | 99.6 | +1.0 | +1.1 | +0.8 |
| Animal feed | 214 | 96.3 | +0.5 | +1.5 | –0.5 |
| Veterinary expenses | 37 | 106.6 | +0.1 | +0.8 | +2.2 |
| Small equipment and tools | 11 | 101.6 | –0.7 | +1.3 | +2.4 |
| Maintenance of materials | 88 | 104.5 | +0.2 | +0.8 | +2.7 |
| Maintenance of buildings | 9 | 104.0 | 0.0 | +0.2 | +1.6 |
| Other goods and services | 61 | 101.4 | +0.1 | +0.1 | –0.3 |
| Goods and services contributing to investment | 240 | 105.0 | 0.0 | +0.4 | +3.0 |
| Material | 168 | 104.4 | 0.0 | +0.4 | +2.6 |
| Tractors | 71 | 106.8 | –0.3 | +0.4 | +4.1 |
| Machinery and equipment for cultivation | 33 | 103.7 | –0.1 | +0.2 | +1.7 |
| Machinery and equipment for harvesting | 38 | 102.9 | +0.4 | +0.6 | +1.3 |
| Utility vehicles | 16 | 99.3 | 0.0 | +0.3 | –0.5 |
| Buildings | 72 | 106.3 | 0.0 | +0.4 | +4.2 |
- (1) The repayment of the domestic tax on energy product (TICPE) benefiting farmers has been applied in advance for the year 2018.
- Sources: INSEE, SSP (ministry in charge of agriculture)
Pour en savoir plus
Time series : Indices of agricultural prices