

 4 May 2018
2018- n° 120In the manufacturing industry, business managers confirm their anticipation of an
increase in their investment in 2018 Industrial investment survey - April 2018
4 May 2018
2018- n° 120In the manufacturing industry, business managers confirm their anticipation of an
increase in their investment in 2018 Industrial investment survey - April 2018
The business managers in industry surveyed in April 2018 stated that their investment increased by 3% in 2017 in nominal terms. Last January's estimate has been upped by 1 point, a revision close to those usually observed in April. For 2018, the business leaders in industry forecast a 5% increase in their investment spending compared with 2017.
The business managers in industry surveyed in April 2018 stated that their investment increased by 3% in 2017 in nominal terms. Last January's estimate has been upped by 1 point, a revision close to those usually observed in April. For 2018, the business leaders in industry forecast a 5% increase in their investment spending compared with 2017.
graphiqueGraph 1 – Annual nominal change in investment in the manufacturing industry
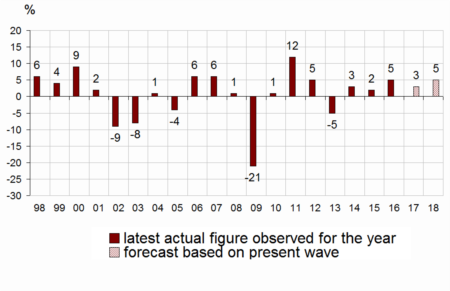
- Source: INSEE - Industrial investment survey
For 2018, business managers have revised upwards their investment forecast to 5%
With an expected overall increase of 5% in investment for 2018, business managers have upped by 1 point their January 2018 estimate, whereas usually they maintain their forecast at that moment of the year (between 2004 and 2017 the average revision has been null). The upward revision is substantial in the sector of transport equipment.
The estimate for 2018 might be revised again during the next quarters: the forecast issued in April tends to overestimate the investment growth finally stated in July of the following year.
tableauTable 1 – Real annual investment growth in manufacturing industry by major sector
| NA* : (A17) et [A38] | In 2017 | In 2018 | ||
|---|---|---|---|---|
| estimate Jan.18 | estimate Apr.18 | forecast Jan.18 | forecast Apr.18 | |
| C : MANUFACTURING INDUSTRY | 2 | 3 | 4 | 5 |
| (C1): Manufacture of food products and beverages | 4 | 5 | 0 | 0 |
| (C3): Electrical and electronic equipment; machine equipment | 18 | 17 | 18 | 15 |
| (C4): Manufacture of transport equipment | –9 | –7 | –7 | 2 |
| [CL1]: Motor vehicles | –12 | –8 | –5 | 4 |
| (C5): Other manufacturing | 2 | 3 | 6 | 6 |
| Total sectors (C3-C4-C5) | 1 | 2 | 5 | 7 |
- How to read this table: In the manufacturing industry, firms surveyed in April 2018 observed a nominal investment increase of 3% in 2017 compared with 2016 and forecast an increase of 5% in 2018 compared with 2017.
- * The codes correspond to the level of aggregation (A17) and [A38] of the "NA" aggregate classification based on NAF rev.2.
- Source: INSEE - Industrial investment survey
More business leaders forecast an increase than a decrease in their investment in H2 2018
In April 2018, more business managers in industry reported a rise rather than a fall in their investment for H1 2018. The balance for the current semester (+16) is close to the October estimate, above its long-term average (+6).
For H2 2018, more business managers also forecast an increase in their investment than a drop. The balance for the expected next semester is almost stable compared to October (to +10) and remains above its long-term average (+6).
graphiqueGraph 2 – Opinion of industrials regarding six-month change in investment (first estimation)
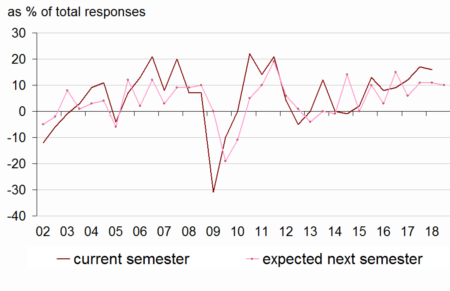
- Note: this graph illustrates the opinion balances of industrials surveyed for the first time on their investment over the current semester and on their expected investment for the next six months (April and October Survey).
- How to read this graph: In the manufacturing industry, more business leaders surveyed in April 2018 indicated an increase in their investment than a drop between H2 2017 and H1 2018 ("current semester"). More business leaders also anticipated an increase in their investment than a decrease between H1 2018 and H2 2018 ("expected next semester").
- Source: INSEE - Industrial investment survey
Investment mainly aims at replacing and modernising equipment
The purposes of investment forecast for 2018 should be quite similar to those of 2017. The current distribution remains close to the average distribution observed since 1991. The share of investment devoted to replacement stays the most important. A quarter of investment should be used for modernising equipment, while the share for energy savings remains slightly above its long-term average. On the other hand, the share of investment aimed at increasing productive capacity or introducing new products is likely to remain a little below its long-term average.
tableauTable 2 – Breakdown of the purposes of investment
| Average | 2017 | 2018 | |
|---|---|---|---|
| 1991-2017 | actual | forecast | |
| Replacement | 27 | 29 | 29 |
| Modernization, streamlining | 24 | 23 | 23 |
| automation | 11 | 8 | 8 |
| new production methods | 7 | 7 | 7 |
| energy savings | 6 | 8 | 8 |
| Increase in productive capacity | 16 | 16 | 16 |
| Introduction of new products | 13 | 12 | 12 |
| Other purposes (safety, environment, working conditions…) | 20 | 20 | 21 |
- Source: INSEE - Industrial investment survey
More companies decommissioned equipment in 2017 than expected in the April 2017 survey. The first reason for scrapping remains equipment wear and tear.
For 2018, business leaders are more numerous than in 2017 to anticipate an increase in their productive capacity: the balance of opinion has reached +45, its highest level since 2001.
tableauTable 3 – Productive capacity and equipment scrapping
| Observed | Forecast | ||||
|---|---|---|---|---|---|
| aver. | in 2017 | aver. | for 2017 | for 2018 | |
| Change in productive capacity* | 30 | 32 | 32 | 31 | 45 |
| Change in equipment scrapping* | 17 | 9 | –2 | –4 | 2 |
| Share of enterprises reporting equipment scrapping** | 75 | 71 | 74 | 66 | 68 |
| Breakdown of enterprises reporting equipment scrapping** | |||||
| Wear and tear, obsolescence | 52 | 58 | 49 | 56 | 59 |
| Installation of more efficient equipment | 31 | 32 | 33 | 32 | 34 |
| Shut-down of capacity for old products | 11 | 7 | 11 | 7 | 6 |
| Other scrapping | 5 | 3 | 6 | 5 | 1 |
- Source: INSEE - Industrial investment survey
Documentation
Methodology 2017 (pdf,147 Ko)
Pour en savoir plus
Time series : Industry – Investment