

 27 April 2018
2018- n° 115In March 2018, agricultural prices rose slightly (+0.3% over one year) Indices of agricultural prices - March 2018
27 April 2018
2018- n° 115In March 2018, agricultural prices rose slightly (+0.3% over one year) Indices of agricultural prices - March 2018
In March 2018, agricultural products prices increased by 0.3% over one year after two months of decline (−1.4% in February and −1.6% in January). Excluding fruits and vegetables, prices were up by 0.3% over one month and went down by 0.8% over one year (after −1.2%).
In March 2018, agricultural products prices increased by 0.3% over one year after two months of decline (−1.4% in February and −1.6% in January). Excluding fruits and vegetables, prices were up by 0.3% over one month and went down by 0.8% over one year (after −1.2%).
Higher cereals and oilseeds prices
In March 2018, cereal prices accelerated to +2.4% over one month after +1.5% in February. Soft wheat prices increased again: +1.6% in March after +2.1% in February. Grain maize prices rebounded in March to +5.5% after −0.2% in February. These increases are the result of drought concerns in the United States and Argentina. This drought also allowed oilseed prices to recover slightly in March (+ 0.7%) after three months of decline. The rise over one month is more pronounced for soybean (+3.3%) and sunflower (+2.1%) than for rapeseed (+0.2%). Over one year, nevertheless, oilseed prices declined sharply (−16.3%).
graphiqueGraph1 – Producer prices of cereals
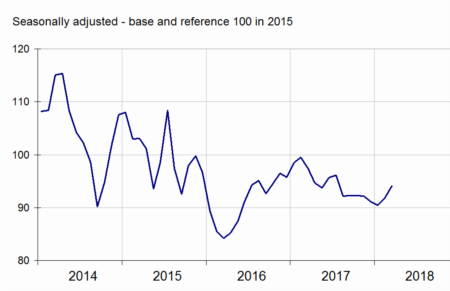
- Source: INSEE
Prices up for fresh fruits and vegetables
In March 2018, fruit prices increased by 23.9% over one year. The apple production deficit pushed their prices up (+22.9% over one year), especially for golden apple (+34.2%). Vegetable prices rose by 9.5% over one year after −23.0% in February. In particular, the trend was reversed for lettuce (+13.9% in March over one year after −38.7% in February) and endives (+7.6% after −20.1%).
graphiqueGraph2 – Producer prices of fresh vegetables
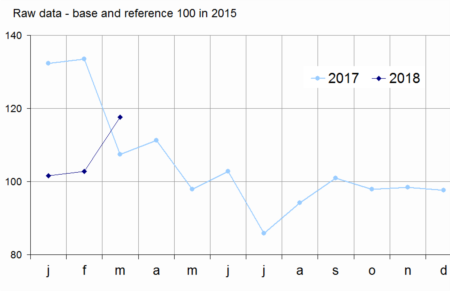
- Source: SSP (ministry in charge of agriculture)
Animal prices rose slightly over a month
In March 2018, animal prices increased by 0.4% but still fell over one year (−1.9% after −2.4% in February). Pig prices rebound continued: +1.5% in March after +0.3% in February and −2.7% in January. Over a year, their prices are down by 12.4%. Those of the big cattle remained firm (+0.2% after −0.9% in February and −1.2% in January). Over one year, they went up by +0.4%.
graphiqueGraph3 – Producer prices of pigs and large cattle
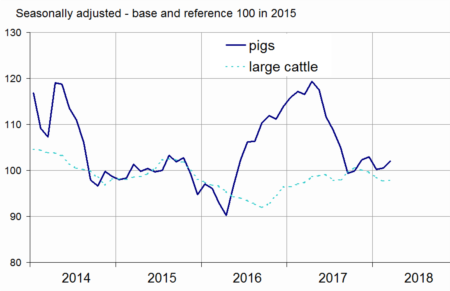
- Source: INSEE
A weaker fall of egg prices
The correction of egg prices that started at the end of the fipronil crisis went on in March 2018 but at a slower pace: −1.8% over one month after −10.7% in February and −12.6% in January. Egg prices were still strongly increasing over one year (+40.4%). The rise of cow's milk prices conserved (+3.8% in February over one year after +4.0% in January).
tableautable1 – Index of producer prices of agricultural products (IPPAP)
| Variation as % over | |||||
|---|---|---|---|---|---|
| Weights | March 2018 | a month | 3 months | a year | |
| Agricultural goods output | 1000 | 104.1 | /// | /// | +0.3 |
| excluding fruits and vegetables | 906 | 103.3 | +0.3 | –1.3 | –0.8 |
| Crop output (excluding fruits and vegetables) | 489 | 103.2 | +0.5 | +0.6 | –2.5 |
| Cereals | 152 | 94.1 | +2.4 | +3.4 | –3.4 |
| of which soft wheat | 90 | 92.5 | +1.6 | +3.1 | –5.1 |
| grain maize | 27 | 100.0 | +5.5 | +3.0 | –6.4 |
| Potatoes | 29 | 118.5 | /// | /// | –32.8 |
| Wines | 200 | 111.3 | –0.2 | +0.2 | +7.3 |
| PDO wines | 112 | 120.7 | –0.6 | –0.1 | +11.4 |
| other wines | 25 | 96.1 | +1.9 | +2.1 | +5.8 |
| Oleaginous | 40 | 89.5 | +0.7 | –3.6 | –16.3 |
| Horticultural products | 35 | 103.6 | –0.9 | 0.0 | +5.7 |
| Other crop products | 33 | 99.2 | 0.0 | –0.2 | –5.9 |
| Fruits and vegetables (1) | 94 | 112.7 | /// | /// | +12.4 |
| Fresh vegetables | 45 | 117.6 | /// | /// | +9.5 |
| Fresh fruits | 32 | 128.7 | /// | /// | +23.9 |
| Animal output | 417 | 103.5 | +0.2 | –3.4 | +1.4 |
| Animals | 255 | 99.1 | +0.4 | –0.9 | –1.9 |
| of which large cattle | 112 | 97.8 | +0.2 | –1.9 | +0.4 |
| calves | 20 | 100.7 | +0.5 | –0.9 | +1.7 |
| pigs | 49 | 102.0 | +1.5 | –1.0 | –12.4 |
| sheep | 14 | 104.0 | +3.1 | +3.7 | +14.7 |
| poultry | 57 | 97.2 | –0.4 | –0.4 | –1.0 |
| of which chicken | 39 | 97.0 | –0.4 | –0.5 | –0.8 |
| Milk | 146 | 105.1 | /// | –3.2 | +2.1 |
| of which cow milk (2) | 135 | 105.4 | /// | –3.5 | +2.3 |
| Eggs | 16 | 157.8 | –1.8 | –23.4 | +40.4 |
- * cf. methodological note
- /// Absence of meaning due to the nature of these series
- (1) Including vegetables for industry.
- (2) The February value of cow milk price index is the estimate of the March one. The previous month variation is the one commented in the text: +3,8% over one year in February 2018.
- Sources: INSEE, SSP (ministry in charge of agriculture)
Increase in means of production purchase prices
In March 2018, purchase prices of means of production rose by 1.4% over one year. Intermediate consumption prices went up by 0.8% over one year due to energy prices rise (+6.4% over one year). Other price growthes were offset by declines in fertilizer and soil improvers prices (−1.2%) and animal feeds (−1.0%). Over a month, these prices increased: +0.5% for energy, +0.3% for fertilizers and soil improvers and +0.5% for animal feed. Prices for capital goods were stable over one month and up 3.0% over one year.
Revision
The variation over one year of IPPAP has been reduced by 0.4 points in February to −1.4%, This correction is due to the revision of the price of cow's milk and some wines ; The variation over one year of IPAMPA has been rosen by 0.1 points at +1.0%.
graphiqueGraph4 – Purchase prices of the means of agricultural production
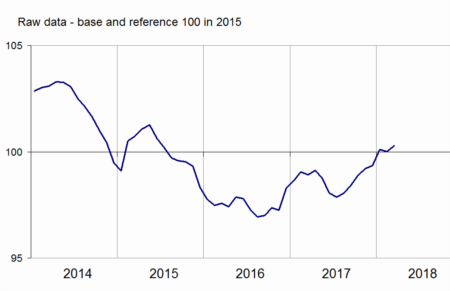
- Sources: INSEE, SSP (ministry in charge of agriculture)
tableautable2 – Indices of purchase prices of the means of agricultural production (IPAMPA)
| Variation as % over | |||||
|---|---|---|---|---|---|
| Weights | March 2018 | a month | 3 months | a year | |
| Total input | 1000 | 100.3 | +0.3 | +1.0 | +1.4 |
| Intermediate consumptions | 760 | 98.8 | +0.3 | +1.0 | +0.8 |
| Energy | 93 | 109.0 | +0.5 | +1.6 | +6.4 |
| Seeds | 56 | 97.0 | +0.1 | +0.4 | –0.1 |
| Fertilisers and soil improvers | 107 | 88.2 | +0.3 | +1.6 | –1.2 |
| Plant protection products | 84 | 98.7 | +0.4 | +0.3 | +0.4 |
| Animal feed | 214 | 95.7 | +0.5 | +1.5 | –1.0 |
| Veterinary expenses | 37 | 106.5 | +0.4 | +0.9 | +2.3 |
| Small equipment and tools | 11 | 100.3 | +0.7 | +0.2 | +1.5 |
| Maintenance of materials | 88 | 104.3 | +0.2 | +1.5 | +2.7 |
| Maintenance of buildings | 9 | 103.8 | 0.0 | +0.4 | +1.5 |
| Other goods and services | 61 | 101.3 | 0.0 | –0.6 | –0.6 |
| Goods and services contributing to investment | 240 | 104.9 | 0.0 | +0.6 | +3.0 |
| Material | 168 | 104.4 | 0.0 | +0.4 | +2.6 |
| Tractors | 71 | 107.1 | –0.2 | +0.8 | +4.3 |
| Machinery and equipment for cultivation | 33 | 103.8 | 0.0 | +0.3 | +1.8 |
| Machinery and equipment for harvesting | 38 | 102.5 | +0.1 | +0.2 | +1.0 |
| Utility vehicles | 16 | 99.3 | +0.5 | –0.6 | –0.3 |
| Buildings | 72 | 105.9 | 0.0 | +1.0 | +4.1 |
- (1) The repayment of the domestic tax on energy product (TICPE) benefiting farmers has been applied in advance for the year 2018.
- Sources: INSEE, SSP (ministry in charge of agriculture)
Pour en savoir plus
Time series : Indices of agricultural prices