

 24 April 2018
2018- n° 104In April 2018, the business climate remains stable in services Monthly survey of services - April 2018
24 April 2018
2018- n° 104In April 2018, the business climate remains stable in services Monthly survey of services - April 2018
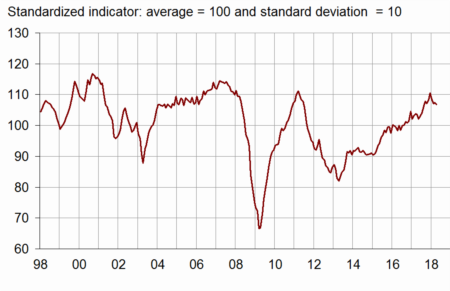
According to business managers surveyed in April 2018, the business climate remains stable in services. The composite indicator which measures has stood at 107 since February 2018, well above its long-term average (100).
- Optimism persists on expected activity but weakens on expected demand
- In road transport, the business climate has weakened notably
- The business climate is virtually stable in accommodation and food service activities
- In information and communication, the business climate has improved slightly
- The real estate business climate has deteriorated slightly
- The business climate is stable in professional, scientific and technical activities
- In administrative and support service activities, the business climate remains at a high level
According to business managers surveyed in April 2018, the business climate remains stable in services. The composite indicator which measures has stood at 107 since February 2018, well above its long-term average (100).
graphiqueGraph 1 – Business climate composite indicator
The turning point indicator has been in the area indicating an uncertaint short-term economic situation since February 2018.
graphiqueGraph 2 – Turning point indicator
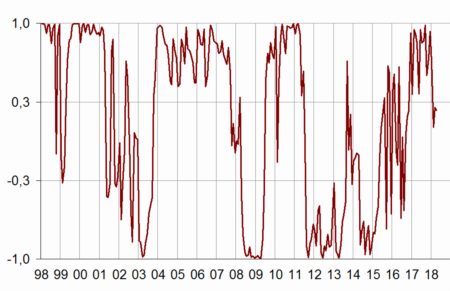
- Note: close to 1 (respectively –1), this indicator indicates a favourable short-term economic situation (respectively unfavourable). The uncertainty area is between –0.3 and +0.3.
Optimism persists on expected activity but weakens on expected demand
The balances of opinion on past and expected activity have increased a little this month. In contrast, the balance on expected demand has fallen back sharply. That on general outlook has been declining since February. All these balances remain well above their long-term average.
The balances on past and expected employment have
dipped, mainly due to temporary work agencies. That on past employment has met its average level whereas that on expected employment remains well above.
The balance on past operating balance result has declined whereas that on expected result has grown.
In April 2018, more business managers than in January have reported difficulties of supply only, their proportion reaching an unseen level. They are also more numerous to point out difficulties in recruitment. The corresponding balance has been increasing continually since April 2016 and has reached its highest level since January 2008. In contrast, that on difficulties of demand only has fallen to its lowest level since April 2008.
tableauTable 1 – Economic outlook in the services sector
| Average* | Jan. 18 | Feb. 18 | March 18 | April 18 | |
|---|---|---|---|---|---|
| Composite indicator | 100 | 109 | 107 | 107 | 107 |
| General outlook | –7 | 5 | 4 | 3 | 2 |
| Past activity | 2 | 14 | 9 | 6 | 8 |
| Expected activity | 2 | 4 | 3 | 4 | 5 |
| Expected demand | 0 | 8 | 6 | 8 | 4 |
| Past selling prices | –4 | 0 | –2 | –2 | –1 |
| Expected selling prices | –3 | –2 | –4 | –3 | –3 |
| Past employment | 3 | 10 | 13 | 8 | 3 |
| except temporary work agencies | 1 | 4 | 5 | 3 | 2 |
| Expected employment | 2 | 9 | 10 | 15 | 13 |
| except temporary work agencies | 0 | 5 | 5 | 6 | 6 |
| Investments | |||||
| Past investments | 2 | 4 | 7 | 4 | 7 |
| Expected investments | 1 | 1 | 6 | 5 | 4 |
| Operating balance result | |||||
| Past result | –2 | 5 | 1 | ||
| Expected result | –2 | –2 | 2 | ||
| Cash position | –11 | –5 | –6 | ||
| Difficulties of supply and demand | |||||
| difficulties of supply and demand | 10 | 10 | 8 | ||
| difficulties of supply only | 22 | 29 | 32 | ||
| difficulties of demand only | 32 | 27 | 23 | ||
| Difficulties in recruitment | 28 | 34 | 37 |
- * Average since 1989 for the composite indicator and since 1988 for the balances of opinion
- Source: Insee, business survey in services
The business climate is above its average in almost all sub-sectors, except in real estate activities. It has gone down in transport, in real estate and in administrative and support service activities. It is stable or virtually stable in professional activities and in accommodation and food service activities. It has improved slightly in information-communication.
In road transport, the business climate has weakened notably
In road transport, the business climate has lost four points (110) but stands well above its average level. All balances of opinion have decreased, in particular the balances on employment, on expected activity and on general outlook. However, all balances are well above their average.
The business climate is virtually stable in accommodation and food service activities
In accommodation and food service activities, the business climate is virtually stable, at 110, thus remaining well above its average. The balance on past activity has recovered strongly. In contrast, the balances on expected activity and expected demand have fallen back. Only the balance on past employment is below its average.
In information and communication, the business climate has improved slightly
In information and communication, the climate has edged up by one point (103) and remains above its average. The balances on past activity, on expected activity and on past employment have increased sharply whereas that on expected demand has slipped back.
The real estate business climate has deteriorated slightly
In real estate activities, the business climate has lost one point (88). The opinion on general outlook remains very deteriorated. The balances on expected demand and on past activity have declined markedly whereas that on past and expected employment have climbed sharply. Only the balance on expected employment exceeds its long-term average.
The business climate is stable in professional, scientific and technical activities
In professional, scientific and technical activities, the business climate is still at 110, well above its average level. The decline in the balances on expected activity and on expected demand has been offset by the rise in the balances on past activity, on employment and on general outlook. All these balances are markedly above their average.
In administrative and support service activities, the business climate remains at a high level
In administrative and support service activities, the business climate has barely weakened. At 111, it has remains well above its average. The balances on past activity and employment have slipped back markedly. Only the balance on past employment is below its average.
tableauTable 2 – Business climate composite indicator and balances of opinion by sub-sector in services
| Aggregated classification (NA 2008) at level A21 | Mean* | Jan. 18 | Feb. 18 | March 18 | April 18 |
|---|---|---|---|---|---|
| Road transport (8%) | |||||
| Composite indicator | 100 | 111 | 115 | 114 | 110 |
| Past activity | –7 | 13 | 15 | 16 | 13 |
| Expected activity | –8 | 3 | 12 | 11 | 6 |
| Expected demand | –10 | 11 | 23 | 13 | 8 |
| Past employment | –6 | 11 | 13 | 18 | –1 |
| Expected employment | –8 | 7 | 5 | 8 | 2 |
| General outlook | –20 | 11 | 13 | 12 | 5 |
| Accommodation and food service activities (11%) | |||||
| Composite indicator | 100 | 113 | 116 | 109 | 110 |
| Past activity | –7 | 8 | 2 | –9 | 4 |
| Expected activity | –7 | –1 | 7 | 2 | 1 |
| Expected demand | –9 | –1 | 3 | 4 | –1 |
| Past employment | –4 | 0 | 5 | –7 | –7 |
| Expected employment | –5 | –6 | –2 | –3 | –3 |
| General outlook | –14 | 9 | 9 | –4 | –2 |
| Information and communication (24%) | |||||
| Composite indicator | 100 | 105 | 103 | 102 | 103 |
| Past activity | 8 | 22 | 11 | 3 | 7 |
| Expected activity | 9 | 9 | –3 | 1 | 5 |
| Expected demand | 10 | 6 | –1 | 10 | 4 |
| Past employment | 6 | 18 | 18 | 16 | 20 |
| Expected employment | 11 | 15 | 18 | 13 | 12 |
| General outlook | 0 | 3 | 5 | 3 | 3 |
| Real estate activities (13%) | |||||
| Composite indicator | 100 | 85 | 86 | 89 | 88 |
| Past activity | 7 | 13 | 10 | 2 | –3 |
| Expected activity | 7 | –18 | –8 | –2 | –3 |
| Expected demand | 2 | 4 | 2 | 5 | 2 |
| Past employment | 3 | 5 | 1 | –6 | 1 |
| Expected employment | 3 | –2 | –3 | 3 | 11 |
| General outlook | –2 | –13 | –17 | –15 | –16 |
| Professional, scientific and technical activities (24%) | |||||
| Composite indicator | 100 | 111 | 108 | 110 | 110 |
| Past activity | –1 | 7 | 1 | 6 | 9 |
| Expected activity | –2 | 6 | 5 | 6 | 3 |
| Expected demand | –5 | 5 | 3 | 4 | 3 |
| Past employment | 1 | 12 | 9 | 6 | 9 |
| Expected employment | 0 | 11 | 11 | 10 | 12 |
| General outlook | –9 | 4 | 1 | 3 | 4 |
| Administrative and support service activities (18%) | |||||
| Composite indicator | 100 | 113 | 111 | 112 | 111 |
| Past activity | 6 | 23 | 23 | 24 | 14 |
| Expected activity | 5 | 14 | 15 | 15 | 17 |
| Expected demand | 3 | 22 | 16 | 15 | 13 |
| Past employment | 10 | 17 | 23 | 13 | 1 |
| Expected employment | 8 | 14 | 17 | 33 | 26 |
| General outlook | –4 | 13 | 10 | 11 | 10 |
- The figures in parentheses indicate the weights used to aggregate the sub-sector balances of opinion.
- *Composite indicator: average since 1989 (2006 for road transport); balances of opinion: average since 1988 (2006 for road transport)
- Source: INSEE, monthly business survey in services.
Documentation
Abbreviated Methodology (2017) (pdf,177 Ko)
Pour en savoir plus
Time series : Economic outlook surveys – Services