

 30 March 2018
2018- n° 92In February 2018, agricultural prices fell by 1.8% over one year Indices of agricultural prices - February 2018
30 March 2018
2018- n° 92In February 2018, agricultural prices fell by 1.8% over one year Indices of agricultural prices - February 2018
In February 2018, agricultural products prices decreased by 1.8% over one year (after −1.7% in January). Excluding fruits and vegetables, they were almost unchanged over one month and went down by 1.6% over one year (after −1.3%).
In February 2018, agricultural products prices decreased by 1.8% over one year (after −1.7% in January). Excluding fruits and vegetables, they were almost unchanged over one month and went down by 1.6% over one year (after −1.3%).
Rise in prices for cereals, decline for oilseeds
In February 2018, soft wheat prices increased by 2.1% over one month (after −0.7%). This bounce back was the result of concerns about weather conditions in the United States (drought) and Europe (cold) as well as euro decline against the dollar. Grain maize prices decreased slightly over one month (−0.2% after −2.2% in January). Oilseed prices went down at a much slower pace: −0.4% over one month in February after −3.8% in January. Nevertheless, they fall sharply over one year (−19.3%).
graphiqueGraph1 – Producer prices of cereals
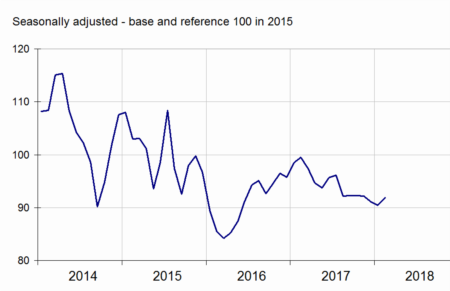
- Source: INSEE
Fresh vegetables prices down, fresh fruits up
In February 2018, fresh vegetable prices fell by 23.0% over one year, mainly due to price declines of 20.1% for chicory, 38.1% for salads and 42.7% for leeks. On the opposite, fresh fruit prices accelerated: +21.3% over one year in February after +15.5% in January. They were pulled up by kiwifruit prices (+44.7% over one year), apples (+20.2%) and pears (+8.8%).
graphiqueGraph2 – Producer prices of fresh vegetables
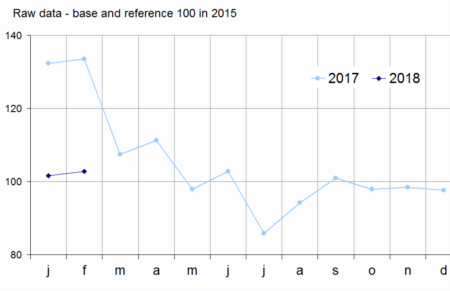
- Source: SSP (ministry in charge of agriculture)
Steady prices over a month for animals
In February 2018, animal prices were almost stable over one month (−0.1% after −1.2% in January). However, their decline over one year was accentuated: −2.4% after −2.0% in January. Pig prices recovered a little over one month (+0.3% after −2.7% in January). Prices for cattle faltered again: −0,9% in February after −1,2% in January. Over one year, their rise weakened (+0.5% after +2.1%).
graphiqueGraph3 – Producer prices of pigs and large cattle
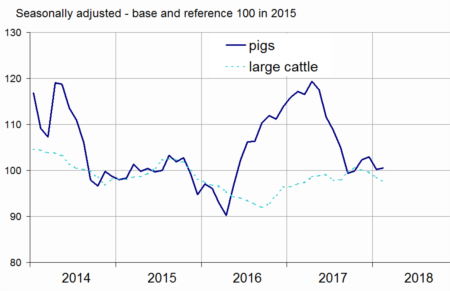
- Source: INSEE
Egg prices fell again
After rising for several months due to the fipronil crisis, egg prices went down for the second consecutive month in February 2018 (−10.7% after −12.6% in January). They were still up by 59.4% over one year. The price of cow's milk slowed down over one year: +4.0% in January after + 10.7% in December 2017.
tableautable1 – Index of producer prices of agricultural products (IPPAP)
| Variation as % over | |||||
|---|---|---|---|---|---|
| Weights | Fev 2018 | a month | 3 months | a year | |
| Agricultural goods output | 1000 | 103.1 | /// | /// | –1.8 |
| excluding fruits and vegetables | 906 | 102.6 | –0.1 | –2.0 | –1.6 |
| Crop output (excluding fruits and vegetables) | 489 | 102.3 | +0.5 | –0.3 | –4.3 |
| Cereals | 152 | 91.9 | +1.5 | –0.2 | –7.6 |
| of which soft wheat | 90 | 91.0 | +2.1 | –0.9 | –9.3 |
| grain maize | 27 | 94.8 | –0.2 | –1.3 | –12.3 |
| Potatoes | 29 | 119.8 | /// | /// | –31.7 |
| Wines | 200 | 110.8 | +0.4 | +1.7 | +7.6 |
| PDO wines | 112 | 120.2 | +0.6 | +2.6 | +12.3 |
| other wines | 25 | 94.3 | 0.0 | +1.2 | +3.5 |
| Oleaginous | 40 | 88.9 | –0.4 | –7.4 | –19.3 |
| Horticultural products | 35 | 102.9 | –0.6 | –1.4 | –0.1 |
| Other crop products | 33 | 99.2 | –0.1 | –4.6 | –6.6 |
| Fruits and vegetables (1) | 94 | 109.7 | /// | /// | –3.5 |
| Fresh vegetables | 45 | 102.8 | /// | /// | –23.0 |
| Fresh fruits | 32 | 126.6 | /// | /// | +21.3 |
| Animal output | 417 | 103.0 | –0.9 | –4.0 | +1.8 |
| Animals | 255 | 98.7 | –0.1 | –1.6 | –2.4 |
| of which large cattle | 112 | 97.6 | –0.9 | –2.5 | +0.5 |
| calves | 20 | 100.2 | –0.3 | –1.4 | +1.2 |
| pigs | 49 | 100.5 | +0.3 | –1.8 | –14.2 |
| sheep | 14 | 100.9 | +2.3 | +1.1 | +9.4 |
| poultry | 57 | 97.6 | +0.2 | –0.7 | –0.9 |
| of which chicken | 39 | 97.4 | +0.2 | –0.9 | –0.9 |
| Milk | 146 | 104.3 | /// | –4.2 | +2.8 |
| of which cow milk (2) | 135 | 104.5 | /// | –4.6 | +3.0 |
| Eggs | 16 | 160.7 | –10.7 | –20.6 | +59.4 |
- * cf. methodological note
- /// Absence of meaning due to the nature of these series
- (1) Including vegetables for industry.
- (2) The January value of cow milk price index is the estimate of the February one. The previous month variation is the one commented in the text: +4,0% over one year in January 2018.
- Sources: INSEE, SSP (ministry in charge of agriculture)
Means of production purchase prices slackened
In February 2018, purchase prices of means of production slowed down 2018 over one year (+0.9% after +1.4%). Intermediate consumption prices were less dynamic (+0.3% after +0.9%); over one month they fall slightly (−0.2% after + 0.9% in January). Energy prices decline (−3.0% in February after +4.3%) more than offseted higher prices for fertilizers and amendments (+0.6%) and animal feed (+0,3%). In contrast, the prices of capital goods rose slightly in February (+0.3%) after a near-stability in January.
Revision
The variation over one year of IPPAP has been reduced by 0.6 points in January to −1.7%, This correction is due to the revision of the price of cow's milk. The variation over one year of IPAMPA has been rosen by 0.2 points at +1.4%.
graphiqueGraph4 – Purchase prices of the means of agricultural production
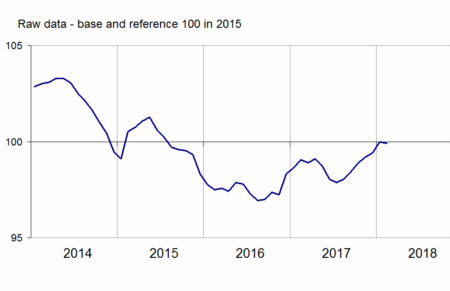
- Sources: INSEE, SSP (ministry in charge of agriculture)
tableautable2 – Indices of purchase prices of the means of agricultural production (IPAMPA)
| Variation as % over | |||||
|---|---|---|---|---|---|
| Weights | Fev 2018 | a month | 3 months | a year | |
| Total input | 1000 | 99.9 | –0.1 | +0.7 | +0.9 |
| Intermediate consumptions | 760 | 98.5 | –0.2 | +0.8 | +0.3 |
| Energy | 93 | 108.5 | –3.0 | +1.0 | +2.8 |
| Seeds | 56 | 96.8 | +0.2 | +0.1 | –0.2 |
| Fertilisers and soil improvers | 107 | 87.9 | +0.6 | +1.9 | –1.1 |
| Plant protection products | 84 | 98.1 | –0.3 | –0.4 | –0.1 |
| Animal feed | 214 | 95.2 | +0.3 | +0.8 | –1.3 |
| Veterinary expenses | 37 | 106.1 | +0.3 | +0.6 | +2.0 |
| Small equipment and tools | 11 | 98.1 | –2.2 | –1.6 | –0.9 |
| Maintenance of materials | 88 | 104.1 | +0.4 | +1.5 | +2.5 |
| Maintenance of buildings | 9 | 103.4 | 0.0 | +0.2 | +1.3 |
| Other goods and services | 61 | 102.0 | 0.0 | +0.1 | +0.1 |
| Goods and services contributing to investment | 240 | 104.5 | +0.3 | +0.6 | +2.9 |
| Material | 168 | 104.4 | +0.4 | +0.6 | +2.9 |
| Tractors | 71 | 107.3 | +0.8 | +0.7 | +4.9 |
| Machinery and equipment for cultivation | 33 | 103.8 | +0.3 | +0.7 | +2.7 |
| Machinery and equipment for harvesting | 38 | 102.4 | +0.1 | +0.1 | +0.4 |
| Utility vehicles | 16 | 98.8 | –0.2 | –0.7 | –0.6 |
| Buildings | 72 | 104.8 | 0.0 | +0.7 | +3.0 |
- (1) The repayment of the domestic tax on energy product (TICPE) benefiting farmers has been applied in advance for the year 2018.
- Sources: INSEE, SSP (ministry in charge of agriculture)
Pour en savoir plus
Time series : Indices of agricultural prices