

 30 March 2018
2018- n° 88In January 2018, the turnover in the manufacturing industry fell back (−0.4%) Turnover in industry and construction - January 2018
30 March 2018
2018- n° 88In January 2018, the turnover in the manufacturing industry fell back (−0.4%) Turnover in industry and construction - January 2018
In January 2018, the turnover fell back in the manufacturing industry (−0.4% after +0.1% in december 2017). It went down slightly in industry as a whole (−0.2% after +0.1%).
Export turnover fell back (−0.6%) after an increase in December 2017 (+0.7%).
- Sharp increase on the last three months (+1.3%)
- Strong progress compared to the previous year (+5.5%)
- Rebound in food products and beverages (+1.8%)
- Further increase in coke and refined petroleum products (+3.2%)
- Slight increase in “other manufacturing” (+0.2%)
- Strong downturn in transport equipment (−5.5% )
- Virtual stability in machinery and equipment (−0.1%)
- Rebasing and reference change to 2015

Please note: in accordance with European directives, the turnover indices in the industry use 2015 as base and reference year from this publication.
In January 2018, the turnover fell back in the manufacturing industry (−0.4% after +0.1% in december 2017). It went down slightly in industry as a whole (−0.2% after +0.1%).
Export turnover fell back (−0.6%) after an increase in December 2017 (+0.7%).
Sharp increase on the last three months (+1.3%)
The turnover rose sharply over the last three months in the manufacturing industry (+1.3%) as well as in industry as a whole (+1.1%). Within manufacturing, the turnover rose in “other manufacturing” (+1.5%), in the manufacture of coke and refined petroleum products (+10.4%), and in the manufacture of transport equipment (+0.8%). It was stable in the machinery and equipment goods and decreased slightly in the manufacture of food products and beverages (−0.2%).
Strong progress compared to the previous year (+5.5%)
The turnover grew sharply compared to the same three months of the previous year in the manufacturing industry (+5.5%) and in industry as a whole (+5.4%). Over this period, the turnover rose strongly in every main sectors of the manufacturing industry − “other manufacturing” (+6.1%), the manufacture of coke and refined petroleum products (+16.1%), the manufacture of transport equipment (+5.1%), the manufacture of food products and beverages (+3.2%) and the machinery and equipment sector (+4.0%).
graphiqueGraph1 – Turnover in manufacturing industry
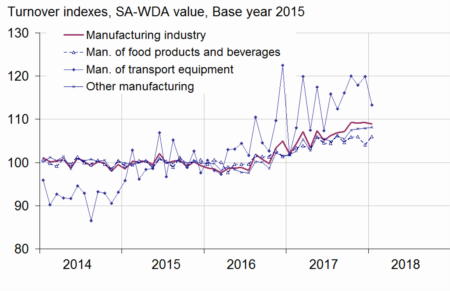
- Sources: DGFiP, INSEE
tableauTable1 – Variation of the turnover in industry and construction
| Change in % | |||||
|---|---|---|---|---|---|
| NA : A 10, (A 17) | Weight (1) | Jan./ Dec. | Dec./ Nov. | q-o-q (2) | y-o-y (3) |
| BE: INDUSTRY | 10000 | −0.2 | 0.1 | 1.1 | 5.4 |
| CZ: MANUFACTURING INDUSTRY | 8371 | −0.4 | 0.1 | 1.3 | 5.5 |
| Of which Exports | 2977 | −0.6 | 0.7 | 0.4 | 3.9 |
| (C1): Manufacture of food products and beverages | 1809 | 1.8 | −1.7 | −0.2 | 3.2 |
| (C2): Manufacture of coke and refined petroleum products | 423 | 3.2 | 4.1 | 10.4 | 16.1 |
| (C3): Machinery and equipment goods | 944 | −0.1 | −0.2 | 0.0 | 4.0 |
| (C4): Manufacture of transport equipment | 1387 | −5.5 | 1.7 | 0.8 | 5.1 |
| (C5): Other manufacturing | 3808 | 0.2 | 0.0 | 1.5 | 6.1 |
| DE: Mining and quarrying; energy; water supply; waste management | 1629 | 0.9 | −0.2 | 0.3 | 5.0 |
| FZ: CONSTRUCTION | 10000 | 1.8 | 0.9 | 2.0 | 7.3 |
- (1) 10000=B...E and F
- (2) Quarter-on-quarter: last three months / previous three months
- (3) Year-on-year: last three months / same three months of previous year
- The codes correspond to different levels of aggregation of the french aggregated classification of activites (NA 2008).
- Sources: DGFiP, INSEE
Rebound in food products and beverages (+1.8%)
In January 2018, the turnover in the manufacture of food products and beverages recovered (+1.8% after −1.7%), despite a decline in export (−1.4% after a virtual stability in December).
Further increase in coke and refined petroleum products (+3.2%)
The turnover in the manufacture of coke and refined petroleum products rose again in January (+3.2% after +4.1%).
Slight increase in “other manufacturing” (+0.2%)
The turnover in “other manufacturing” rose slightly in January (+0.2% after a stability). It accelerated in the manufacture of basic metals and fabricated metal products, except machinery and equipement (+1.8% after +0.5%). It recovered in the manufacture of rubber and plastic products (+0.6% after −0.1%) and in the manufacture of chemicals and chemical products (+0.5% after −0.6%) and rose again in the manufacture of wood and paper products (+0.5% in January as in December). Converserly it fell back sharply in the manufacture of basic pharmaceutical products and pharmaceutical preparations (−5.1% after +2.6%). Export sales in “other manufacturing” rose in January (+1.5% after +0.3%).
Strong downturn in transport equipment (−5.5% )
In January, the turnover in the manufacture of transport equipment fell back strongly (−5.5% after +1.7%). It declined sharply in “other transport equipment” (−11.0% after +2.4%). Conversely it rose again in the manufacture of motor vehicles, trailers and semi-trailers (+0.8% in January and in December 2017). Export turnover in the manufacture of transport equipement also rose (−3.8% after +2.9%).
Virtual stability in machinery and equipment (−0.1%)
In January, the turnover in machinery and equipment was virtually stable (−0.1% after −0.2%). It recorvered in the manufacture of machinery and equipment n.e.c. (+0.4% after −0.4%). On the other hand, it fell back in the manufacture of computer, electronic and optical products (−0.4%) as well as in the manufacture of electrical equipment (−0.5%).
The export sales in machinery and equipment fell again (−1.4% after a stability).
Rebasing and reference change to 2015
Turnover indices are rebased every 5 years. From now on, they have reference year 2015, which means that they have for average 100 in 2015. The 2015 rebasing implements an innovation, with the introduction of a two-weighting system (instead of a constant-weight system) in order to better take into account the structural evolutions. This change responds to a recommandation of Eurostat in order to increase the robustness of indices over a long period. The methodological information concerning these base year and reference changes are available on the Insee Website.
tableauTable2 – Indices of turnover in industry and construction
| Change in % | |||||
|---|---|---|---|---|---|
| Industries: | Weight (1) | Jan. 2018 | Jan. Dec. | Dec./ Nov. | q-o-q (2) |
| BE: INDUSTRY | 10000 | 109.8 | −0.2 | 0.1 | 1.1 |
| CZ: MANUFACTURING INDUSTRY | 8371 | 108.9 | −0.4 | 0.1 | 1.3 |
| of which Exports | 2977 | 110.2 | −0.6 | 0.7 | 0.4 |
| (C1): Man. of food products and beverages | 1809 | 106.0 | 1.8 | −1.7 | −0.2 |
| of which Exports | 330 | 107.4 | −1.4 | 0.1 | −1.4 |
| (C2): Man. of coke and refined petroleum products | 423 | 117.6 | 3.2 | 4.1 | 10.4 |
| (C3): Machinery and equipment goods | 944 | 107.2 | −0.1 | −0.2 | 0.0 |
| of which Exports | 491 | 105.2 | −1.4 | 0.0 | −0.1 |
| [CI] Man. of computer. electronic and optical products | 286 | 109.0 | −0.4 | 0.6 | −0.6 |
| [CJ] Man. of electrical equipment | 225 | 106.4 | −0.5 | −0.7 | 0.6 |
| [CK] Man. of machinery and equipment n.e.c. | 433 | 106.4 | 0.4 | −0.4 | 0.1 |
| (C4): Man. of transport equipment | 1387 | 113.3 | −5.5 | 1.7 | 0.8 |
| of which Exports | 738 | 113.4 | −3.8 | 2.9 | 1.4 |
| [CL1] Man. of motor vehicles. trailers and semi-trailers | 648 | 119.8 | 0.8 | 0.8 | 1.7 |
| [CL2] Man. of other transport equipment | 739 | 107.6 | −11.0 | 2.4 | 0.0 |
| (C5): Other manufacturing | 3808 | 108.2 | 0.2 | 0.0 | 1.5 |
| of which Exports | 1367 | 109.6 | 1.5 | 0.3 | 0.6 |
| [CB] Man. of textiles. wearing apparel. leather and related products | 188 | 104.4 | 0.5 | −1.4 | 2.1 |
| [CC] Man. of wood and paper products; printing and reproduction of recorded media | 402 | 104.7 | 0.5 | 0.5 | 0.0 |
| [CE] Man. of chemicals and chemical products | 768 | 106.7 | 0.5 | −0.6 | 2.3 |
| [CF] Man. of basic pharmaceutical products and pharmaceutical preparations | 296 | 105.1 | −5.1 | 2.6 | −0.6 |
| [CG] Man. of rubber and plastics products. and other non-metallic mineral products | 613 | 109.1 | 0.6 | −0.1 | 1.3 |
| [CH] Man. of basic metals and fabricated metal products. except machinery and equipment | 867 | 112.7 | 1.8 | 0.5 | 2.1 |
| [CM] Other manufacturing; repair and installation of machinery and equipment | 673 | 107.6 | −0.3 | −0.5 | 1.6 |
| DE: Mining and quarrying; energy. water supply. sewerage. waste management | 1629 | 114.6 | 0.9 | −0.2 | 0.3 |
| [BZ] Mining and quarrying | 60 | 106.4 | −0.4 | 0.4 | 0.8 |
| [DZ] Electricity. gas. steam and air-conditioning supply | 1204 | 115.1 | −0.1 | 0.1 | 0.1 |
| [EZ] Water supply; sewerage. waste management and remediation | 365 | 114.3 | 4.6 | −1.4 | 1.0 |
| FZ: CONSTRUCTION | 10000 | 111.9 | 1.8 | 0.9 | 2.0 |
- (1) 10000=B...E and F
- (2) Quarter-on-quarter: last three months / previous three months
- Sources: DGFiP. INSEE
Documentation
Turnover indices (pdf,32 Ko)