

 21 March 2018
2018- n° 71In February 2018, oil prices falls back after a seven-month rising Prices of oil and raw material imports - February 2018
21 March 2018
2018- n° 71In February 2018, oil prices falls back after a seven-month rising Prices of oil and raw material imports - February 2018
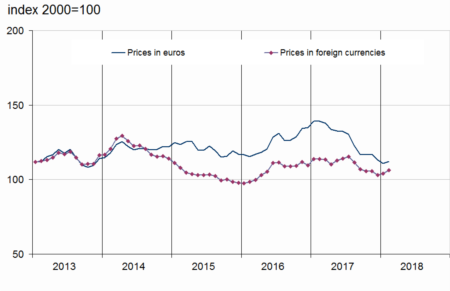
In February 2018, the price of crude oil in euros decreased (−6.6% after +4.1% in January). The prices in euros of all other imported commodities slightly increased (+0.3% after +0.2%). The prices of raw food materials recovered (+1.0% after −2.0%) while the prices of industrial raw materials retreated (–0.4% after +2.3%).

Warning: Since the last issue, the weight of each commodity in agregated indices has been updated, depending on their share in 2017 imports.
In February 2018, the price of crude oil in euros decreased (−6.6% after +4.1% in January). The prices in euros of all other imported commodities slightly increased (+0.3% after +0.2%). The prices of raw food materials recovered (+1.0% after −2.0%) while the prices of industrial raw materials retreated (–0.4% after +2.3%).
Oil price decreased
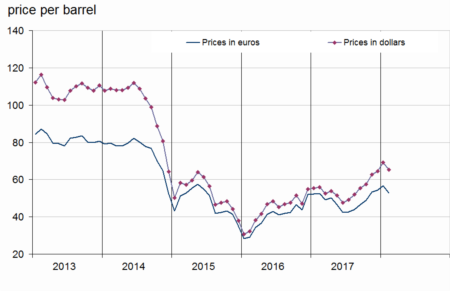
In February 2018, the price of North Sea crude oil (Brent) in euros decreased after a seven-month increase (−6.6% after +4.1% in January) to an average of €53 per barrel. In dollars, the decrease was less marked in February (−5.4% after +7.3%).
tableauTable1 – Oil and petroleum products
| Prices | Change (%) | |||
|---|---|---|---|---|
| of last month | over the last month | over the last 3 months | over the last 12 months | |
| Brent in $ per barrel | 65.3 | –5.4 | 4.2 | 16.6 |
| Brent in € per barrel | 52.9 | –6.6 | –1.0 | 0.5 |
| Gasoline cts €/L | 38.9 | –5.6 | –5.6 | 1.3 |
| Gas Oil | 468.8 | –6.6 | –1.8 | 1.0 |
| Heavy fuel | 321.0 | –1.2 | –0.5 | –0.6 |
| Naphtha | 448.1 | –7.9 | –8.1 | –4.8 |
- Prices are in euros per tonne unless otherwise specified
- Source: INSEE
Food commodity prices recovered
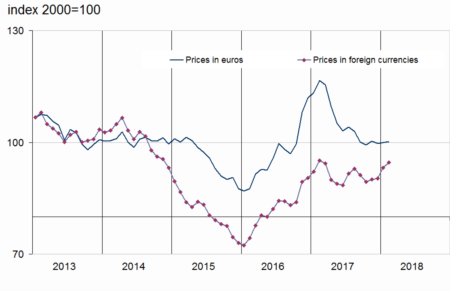
In euros, the prices of raw food materials recovered (+1.0% after −2.0%). The price of meat picked up (+5.7% after −3.7%). The price of oil seeds and vegetable oils bounced back (+2.5% after −2.5%), because of soy prices, supported by concerns about the climate in Argentina. The prices of tropical foodstuffs bounced back too (+0.6% after −1.0%), due to cocoa prices. The price of sugar decreased again (−4.4% after −5.8%). The prices of seafood products decreased more than in January (−3.1% after −1.2%). The prices of cereals slipped back (−0.6%) after a strong increase in January (+3.4%).
Industrial commodity prices slipped back
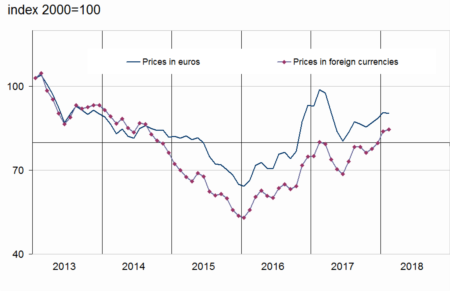
In February 2018, the prices in euros of industrial raw materials slipped back (–0.4% after +2.3%). As a matter of fact, the prices of minerals decreased (−0.8% after +2.8%), largely due to prices retreat in non ferrous metals (−1.3% after +3.6%). The prices of precious metals fell back too (−2.4% after +2.2%) and those of ferrous metals remained virtually stable (+0.1% after +2.8%). The prices of agro-industrial raw materials ramped up (+1.5% after +0.4%). The price of sawn softwood increased again (+4.5% after +4.0%), such as wood pulp price (+2.3% after +0.3%). The price of tropical wood remained virtually stable again (+0.1% after −0.1%). The prices of natural fibres edged down (−0.7% after +2.6%), as well as hides price (−1.1% after +0.2%) and natural rubber price(−4.3% after +1.2%).
tableauTable2 – Imported raw materials (excluding energy) in euros
| Index | Changes (%) | |||
|---|---|---|---|---|
| of last month | over the last month | over the last 3 months | over the last 12 months | |
| Food total | 112.0 | 1.0 | –4.3 | –19.4 |
| Tropical foodstuffs | 91.1 | 0.6 | –6.6 | –22.5 |
| Oil seeds, vegetable oils | 110.0 | 2.5 | –2.4 | –12.7 |
| Cereals | 92.1 | –0.6 | 2.0 | –7.1 |
| Sugar | 65.5 | –4.4 | –14.0 | –42.5 |
| Meat | 138.8 | 5.7 | 3.1 | –2.8 |
| Seafood products | 105.7 | –3.1 | –10.3 | –32.8 |
| Industrial raw materials | 90.3 | –0.4 | 3.8 | –8.7 |
| Agricultural raw materials | 117.9 | 1.5 | 1.8 | –0.4 |
| Natural Fibres | 99.5 | –0.7 | 5.9 | –3.0 |
| Natural rubber | 46.9 | –4.3 | –1.9 | –43.0 |
| Hides | 79.8 | –1.1 | 2.9 | –24.5 |
| Wood pulp | 122.5 | 2.3 | 5.5 | 12.2 |
| Tropical wood | 96.3 | 0.1 | 0.6 | –3.5 |
| Sawn softwood | 220.1 | 4.5 | 2.0 | 20.2 |
| Minerals | 84.9 | –0.8 | 4.3 | –10.4 |
| Ferrous metals | 58.8 | 0.1 | 14.5 | –24.8 |
| Non-ferrous metals | 107.1 | –1.3 | 0.0 | 2.8 |
| Precious metals | 104.3 | –2.4 | –3.4 | –10.7 |
| All commodities | 100.2 | 0.3 | –0.2 | –14.1 |
- Source: INSEE
graphiqueGraph1 – Oil (Brent)
- Source: INSEE
graphiqueGraph3 – Food
- Source: INSEE
graphiqueGraph2 – Imported raw materials (excluding energy)
- Source: INSEE
graphiqueGraph4 – Industrial raw materials
- Source: INSEE
Pour en savoir plus
Time series : Raw materials prices