

 21 March 2018
2018- n° 70In Q4 2017, producer costs for construction accelerated (+1.0%) Costs of production indices in construction - fourth quarter 2017
21 March 2018
2018- n° 70In Q4 2017, producer costs for construction accelerated (+1.0%) Costs of production indices in construction - fourth quarter 2017
In Q4 2017, producer costs for construction accelerated (+1.0% after +0.3% in the two previous quarters). They were dynamic in all sub-sectors: +1.5% (after +0.1%) in civil engineering, +0.9% (after +0.3%) in building construction and in specialised construction works (after +0.4%). Over a year, these costs were still dynamic (+2.7% after +2.1% in Q3 2017), in civil engineering (+3.4% after +2.8%) as well as in building construction (+2.5% after +1.8%) and in specialised construction works (+2.6% after +2.0%).

Avertissement: producer costs for construction will be released in reference 100 in 2015 from mid-June 2018. Additional information related to this change are available on the Web page of these indicators (flag: Documentation), from Insee web site.
In Q4 2017, producer costs for construction accelerated (+1.0% after +0.3% in the two previous quarters). They were dynamic in all sub-sectors: +1.5% (after +0.1%) in civil engineering, +0.9% (after +0.3%) in building construction and in specialised construction works (after +0.4%). Over a year, these costs were still dynamic (+2.7% after +2.1% in Q3 2017), in civil engineering (+3.4% after +2.8%) as well as in building construction (+2.5% after +1.8%) and in specialised construction works (+2.6% after +2.0%).
Materials cost accelerated
In Q4 2017, the cost of materials accelerated in building construction (+1.2% after −0.1%) and in civil engineering (+2.3% after a stability) due to a rise in the price of ribbed bars for reinforce concrete. It increased in renovation of existing buildings (+0.5% after +0.3%) and in specialised works for civil engineering (+0.7% after +0.2%).
Over a year, materials cost remained particularly dynamic in civil engineering (+4.7% after +8.5%), once again due to an increase in the price of ribbed bars for reinforce concrete.
Energy cost increased sharply
In Q4 2017, the cost of energy increased sharply in building construction (+5.7% after −1.5%) and in public works (+6.2% after −1.6%) due to a large increase in prices of fuel oil and gas oil.
Over a year, the increase in the cost of energy remained significant (+7.3% after +7.4% in public works and +9.4% after +7.1% in building construction).
tableauTable1 – Variations in producer cost indices for construction
| Heading | Weights (in %) | Q4 2017/ Q3 2017 | Q4 2017/ Q4 2016 |
|---|---|---|---|
| F Construction | 100.0 | +1.0 | +2.7 |
| 41.2 Construction of buildings | 10.1 | +0.9 | +2.5 |
| 42 Civil engineering | 16.2 | +1.5 | +3.4 |
| 43 Specialised construction works | 73.7 | +0.9 | +2.6 |
| 43BT Buildings | 64.2 | +0.9 | +2.5 |
| 43BTC New buildings | 24.6 | +0.9 | +2.5 |
| 43BTR Existing buildings | 39.6 | +0.8 | +2.5 |
| 43TP Specialised works for civil engineering | 9.5 | +1.3 | +3.0 |
| Buildings (41.2 + 43BT) | 74.3 | +0.8 | +2.5 |
| Public works (42 + 43TP) | 25.7 | +1.4 | +3.2 |
- Source: INSEE
tableauTable2 – Items of producer cost indices for construction
| Costs | items | Q4 2017/ Q3 2017 | Q4 2017/ Q4 2016 |
|---|---|---|---|
| Equipment | Buildings | +0.2 | -0.8 |
| Public works | 0.0 | +0.4 | |
| Labour | Labour costs in construction | +1.1 | +3.2 |
| Energy | Buildings | +5.7 | +9.4 |
| Public works | +6.2 | +7.3 | |
| Materials | Construction of buildings | +1.2 | +3.3 |
| Existing buildings | +0.5 | +2.8 | |
| Civil engineering | +2.3 | +6.0 | |
| Specialised works for civil engineering | +0.7 | +1.5 |
- Source: INSEE
graphiqueGraph1 – Production costs in construction
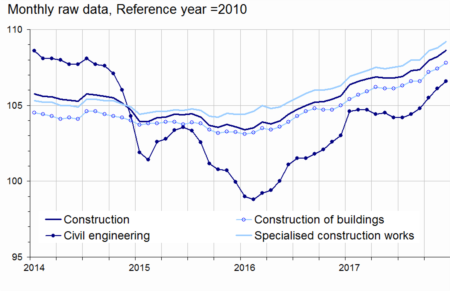
- Source: INSEE
Equipment cost slightly increased in building construction and it was stable in public works
In Q4 2017, equipment cost slightly increased in building construction (+0.2% after −0.2%) but it declined by 0.8% yoy (after −0.5%). In public works, it was stable (−0.4% in Q3 2017) and it increased yoy (+0.4% after +0.3%).
The variation in production costs in construction has been slightly revised upward in Q3 2017
In Q3 2017, the variation in producer costs in construction has been slightly revised upward by 0.1 points, to +0.3%.
graphiqueGraph2 – Materials cost
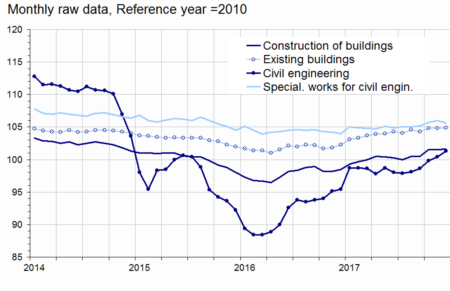
- Source: INSEE
graphiqueGraph3 – Equipment cost
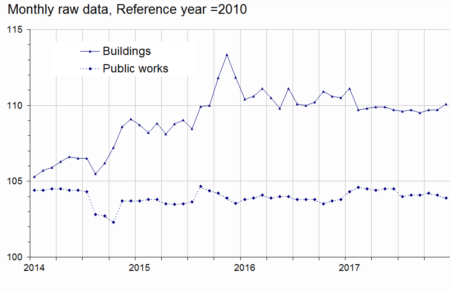
- Source: INSEE
graphiqueGraph4 – Energy cost
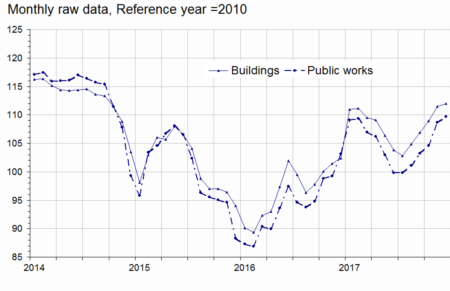
- Source: INSEE
Pour en savoir plus
Time series : Producer cost indices for construction