

 31 January 2018
2018- n° 27In December 2017, agricultural prices fell by 0.3% over one year Indices of agricultural prices - December 2017
31 January 2018
2018- n° 27In December 2017, agricultural prices fell by 0.3% over one year Indices of agricultural prices - December 2017
In December 2017, agricultural products prices slipped back by 0.3% over one year (after +0.3%). Excluding fruits and vegetables, they were stable over one year and almost unchanged over one month (−0.1%).

Information : in accordance with the European directives, index of producer prices of agricultural products and indices of purchase prices of the means of agricultural production will be disseminated in reference year 2015=100 from March 6th 2018, release date of January 2018 results. Additional information (only in French) about changes of the base year indices is available on the Web page of these indicators (flag : Documentation).
In December 2017, agricultural products prices slipped back by 0.3% over one year (after +0.3%). Excluding fruits and vegetables, they were stable over one year and almost unchanged over one month (−0.1%).
Decline in prices for cereals and oilseeds
In December 2017, cereals prices decreased by 1.2% as a result of the 2.3% fall of soft wheat prices. Demand has slowed while supply remained plentiful and crop forecasts were being revised upwards. Grain maize prices gained 1.2% because of drought-related worries in Argentina. Oilseeds prices went down 3.2% after +2.5% in November. The decline is due to an increase in palm oil stocks in Malaysia and a report that expected 2017 Canadian canola production to reach a record level.
graphiqueGraph1 – Producer prices of cereals
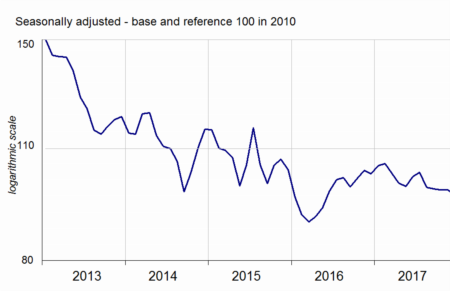
- Source: INSEE
Fresh vegetables prices down, fresh fruits up
In December 2017, fresh vegetables prices dropped by 12.5% over a year due to cauliflower (−25.1%) and salad prices (−7.9%). Prices for fresh fruit increased by 10.4% over a year, especially kiwifruit (+32.7%), clementines (+17.3%) and apples prices (+7.6%).
graphiqueGraph2 – Producer prices of fresh vegetables
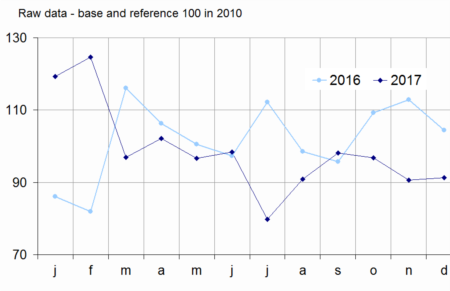
- Source: SSP (ministry in charge of agriculture)
Steady prices for animals
Animal prices were nearly unchanged (−-0.1%) in December 2017. Adjusted for seasonal variations, pig prices rose by +0.6% over one month but were still down by 9.7 over one year. Cattle prices decreased by 0.7% over one month. Yet, they have grown by 4.4% over one year.
graphiqueGraph3 – Producer prices of pigs and large cattle
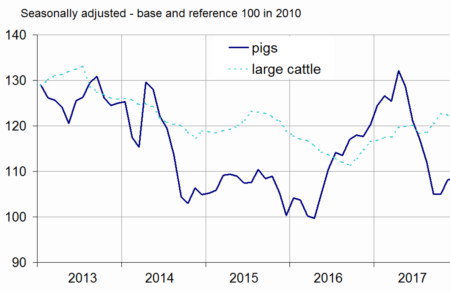
- Source: INSEE
Egg prices in sharp increase over a year
Soaring egg prices following the fipronil crisis fade in December 2017, with prices rising by 1.7% in one month after +22.0% in November. Over a year, they jumped by 58.7%. Following the recovery in global demand for dairy products and particularly the soaring prices of fat, the price of cow's milk rose 14.0% over a year in November.
tableautable1 – Index of producer prices of agricultural products (IPPAP)
| Variation as % over | |||||
|---|---|---|---|---|---|
| Weights | Dec 2017 | a month | 3 months | a year | |
| Agricultural goods output | 1000 | 117.3 | /// | /// | –0.3 |
| excluding fruits and vegetables | 900 | 118.4 | –0.1 | +3.0 | 0.0 |
| Crop output (excluding fruits and vegetables) | 505 | 117.3 | –0.3 | +1.5 | –4.9 |
| Cereals | 188 | 96.6 | –1.2 | –1.4 | –5.7 |
| of which soft wheat | 112 | 92.7 | –2.3 | –2.1 | –6.8 |
| grain maize | 41 | 92.8 | +1.2 | +0.9 | –7.4 |
| Potatoes | 26 | 171.4 | /// | /// | –31.4 |
| Wines | 177 | 141.7 | +1.2 | +5.0 | +4.6 |
| protected designation of origin | 84 | 159.1 | +1.7 | +5.9 | +7.5 |
| other wines | 23 | 141.9 | +1.9 | +13.0 | +2.5 |
| Oleaginous | 49 | 93.5 | –3.2 | –1.5 | –14.7 |
| Horticultural products | 30 | 111.5 | +0.3 | +1.7 | –0.1 |
| Other crop products | 36 | 104.2 | –3.9 | –4.6 | –5.3 |
| Fruits and vegetables (1) | 100 | 107.4 | /// | /// | –2.1 |
| Fresh vegetables | 53 | 91.3 | /// | /// | –12.5 |
| Fresh fruits | 35 | 130.4 | /// | /// | +10.4 |
| Animal output | 395 | 119.8 | +0.1 | +5.1 | +6.8 |
| Animals | 234 | 114.5 | –0.1 | +1.9 | –0.3 |
| of which large cattle | 96 | 121.6 | –0.7 | +0.9 | +4.4 |
| calves | 26 | 111.1 | +2.2 | +8.5 | +3.0 |
| pigs | 54 | 108.6 | +0.6 | +3.4 | –9.7 |
| sheep | 10 | 119.2 | +0.6 | +0.8 | +2.2 |
| poultry | 46 | 107.9 | –0.7 | –1.0 | –1.0 |
| of which chicken | 28 | 107.7 | –0.8 | –1.2 | –1.1 |
| Milk | 147 | 114.2 | /// | +1.6 | +11.2 |
| of which cow milk (2) | 137 | 114.1 | /// | +1.8 | +11.9 |
| Eggs | 15 | 260.3 | +1.7 | +67.1 | +58.7 |
- * cf. methodological note
- /// Absence of meaning due to the nature of these series
- (1) Including vegetables for industry.
- (2) The November value of cow milk price index has been carried forward in December. The previous month variation is the one commented in the text: +14.0% over one year in November 2017.
- Sources: INSEE, SSP (ministry in charge of agriculture)
Slowdown in purchase prices of means of production over a year
Intermediate consumption prices were almost stable in December 2017 (−0.1% after +0.3%). Energy prices slowed down: +0.1% over one month after +3.0% in November. They gained 2.4% over a year after +10.5% in November. Fertilizers and amendments prices went up by 0.5% over one month while animal feeds prices decreased by 0.3%. Capital goods prices were nearly unchanged in December (+0.1% after +0.2%) and increased by 2.6% over one year.
Revision
The variation over one year of IPPAP is unchanged in november 2017 at +0.3%; that of IPAMPA has been rosen by 0.2 points to +1.7%.
graphiqueGraph4 – Purchase prices of the means of agricultural production
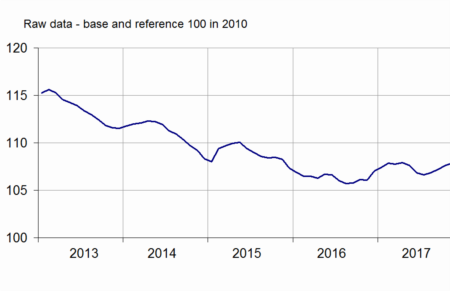
- Sources: INSEE, SSP (ministry in charge of agriculture)
tableautable2 – Indices of purchase prices of the means of agricultural production (IPAMPA)
| Variation as % over | |||||
|---|---|---|---|---|---|
| Weights | Dec 2017 | a month | 3 months | a year | |
| Total input | 1000 | 107.8 | –0.1 | +0.6 | +0.7 |
| Intermediate consumptions | 764 | 106.9 | –0.1 | +0.5 | +0.1 |
| Energy | 100 | 104.4 | +0.1 | +4.6 | +2.4 |
| Seeds | 57 | 105.6 | –0.3 | –0.8 | –0.8 |
| Fertilisers and soil improvers | 92 | 102.5 | +0.5 | +3.9 | +1.7 |
| Plant protection products | 78 | 96.5 | –1.2 | –1.6 | –1.7 |
| Animal feed | 205 | 110.5 | –0.3 | –1.3 | –1.5 |
| Veterinary expenses | 43 | 120.5 | +0.1 | +0.2 | +1.5 |
| Small equipment and tools | 17 | 106.8 | –0.8 | –0.7 | –1.1 |
| Maintenance of materials | 67 | 116.2 | +0.1 | +0.1 | +2.0 |
| Maintenance of buildings | 9 | 109.4 | 0.0 | +0.3 | +1.6 |
| Other goods and services | 97 | 102.4 | 0.0 | +0.3 | +0.1 |
| Goods and services contributing to investment | 236 | 110.7 | +0.1 | +1.0 | +2.6 |
| Material | 186 | 111.6 | +0.1 | +0.9 | +2.2 |
| Tractors | 79 | 114.2 | –0.3 | +1.2 | +4.2 |
| Machinery and equipment for cultivation | 36 | 113.0 | +0.4 | +1.1 | +2.0 |
| Machinery and equipment for harvesting | 42 | 110.0 | –0.1 | +0.5 | +0.1 |
| Utility vehicles | 18 | 104.5 | +0.4 | +0.1 | –0.6 |
| Buildings | 50 | 107.0 | 0.0 | +1.0 | +3.8 |
- (1) The repayment of the domestic tax on energy product (TICPE) benefiting farmers has been applied in advance for the year 2017.
- Sources: INSEE, SSP (ministry in charge of agriculture)
Documentation
Methodology (pdf,122 Ko)
Pour en savoir plus
Time series : Indices of agricultural prices