

 26 January 2018
2018- n° 16In January 2018, the business climate weakens slightly in services Monthly survey of services - January 2018
26 January 2018
2018- n° 16In January 2018, the business climate weakens slightly in services Monthly survey of services - January 2018
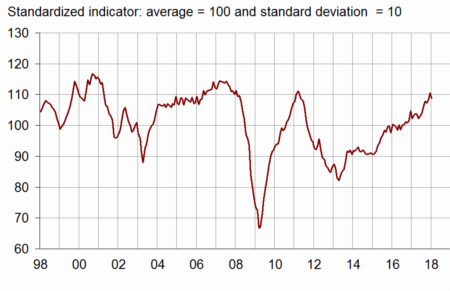
According to business managers surveyed in January 2018, the business climate has declined a little in services. The composite indicator which measures it has lost two points (109). However, it stands clearly above its long-term average (100).
- The balance on expected activity has shrunk sharply
- In road transport, the business climate has weakened
- The business climate is stable in accommodation and food service activities
- In information and communication, the business climate is slightly less favorable
- The real estate business climate has worsened again
- The business climate is stable in professional, scientific and technical activities
- In administrative and support service activities, the business climate has improved again
According to business managers surveyed in January 2018, the business climate has declined a little in services. The composite indicator which measures it has lost two points (109). However, it stands clearly above its long-term average (100).
graphiqueGraph 1 – Business climate composite indicator
The turning point indicator remains in the area indicating a favourable short-term economic situation.
graphiqueGraph 2 – Turning point indicator
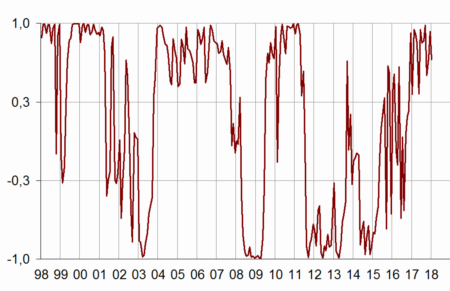
- Note: close to 1 (respectively -1), this indicator indicates a favourable short-term economic situation (respectively unfavourable). The uncertainty area is between -0.3 and +0.3.
The balance on expected activity has shrunk sharply
The balance on expected activity has fallen back markedly in January. That on past activity has also decreased but to a lesser extent. However, these balances remain above their long-term average. Those on general outlook and on expected demand are steady, well above their average level.
The balances on employment have improved slightly due to temporary work agencies and have exceeded their average even more. Meanwhile, after having reached last October its highest level since October 2008, the balance on difficulties in recruitment has declined slightly.
Since April 2017, the balance on difficulties of supply only has exceeded its long-term average whereas that on difficulties of demand only has been below its average.
The balance on the past result of operating balance is steady, above its average level. That on expected result has grown up slightly and met its average.
tableauTable 1 – Economic outlook in the services sector
| Average* | Oct. 17 | Nov. 17 | Dec. 17 | Jan. 18 | |
|---|---|---|---|---|---|
| Composite indicator | 100 | 107 | 108 | 111 | 109 |
| General outlook | –7 | 2 | 3 | 4 | 4 |
| Past activity | 2 | 9 | 12 | 15 | 13 |
| Expected activity | 2 | 8 | 8 | 10 | 4 |
| Expected demand | –1 | 5 | 7 | 8 | 8 |
| Past selling prices | –4 | –5 | 0 | –1 | 0 |
| Expected selling prices | –3 | –3 | –2 | –3 | –2 |
| Past employment | 3 | 10 | 12 | 13 | 15 |
| except temporary work agencies | 1 | 4 | 6 | 4 | 4 |
| Expected employment | 2 | 7 | 5 | 12 | 13 |
| except temporary work agencies | –1 | 5 | 2 | 3 | 3 |
| Investments | |||||
| Past investments | 2 | 6 | 6 | 3 | 3 |
| Expected investments | 1 | 4 | 7 | 1 | 0 |
| Operating balance result | |||||
| Past result | –2 | 5 | 5 | ||
| Expected result | –2 | –3 | –2 | ||
| Cash position | –11 | –7 | –5 | ||
| Difficulties of supply and demand | |||||
| difficulties of supply and demand | 10 | 9 | 10 | ||
| difficulties of supply only | 22 | 30 | 29 | ||
| difficulties of demand only | 32 | 26 | 28 | ||
| Difficulties in recruitment | 28 | 34 | 33 |
- * Average since 1989 for the composite indicator and since 1988 for the balances of opinion
- Source: Insee, business survey in services
The business climate indicator is above its average in all sub-sectors but that in real estate activities. In administrative and support services, it has risen again. However, it has fallen in road transport, in information and communication and in real estate activities.
In road transport, the business climate has weakened
In road transport, the business climate has lost three points (111), mostly due to the strong fall in the balance on expected activity. The balances on past activity, on expected demand and on past employment have dipped a little. However, the balance on general outlook has improved again. All the balances are significantly above their average.
The business climate is stable in accommodation and food service activities
In accommodation and food service activities, the business climate is steady (112), well above its average level. The sharp drop in the balance on past activity is offset by the increase in the balance on general outlook.
In information and communication, the business climate is slightly less favorable
In information and communication, the climate has lost two points (105). However it remains above its long-term average. The balances on expected activity and on general outlook have fallen. In contrast, the balances on employment have improved slightly.
The real estate business climate has worsened again
In real estate activities, the business climate has lost six points (85) because of the drop in the balances on expected employment and on expected activity. It is at its lowest level since July 2009, weighed down by the sub-sector of housing rental. The balances on expected activity, on expected employment and on general outlook are markedly below their average.
The business climate is stable in professional, scientific and technical activities
In professional, scientific and technical activities, the business climate remains at 111, well above its average level. All the balances are clearly above their long-term average.
In administrative and support service activities, the business climate has improved again
In administrative and support service activities, the business climate has increased for the sixth month in a row and reached its highest level since June 2007. The balances on past activity and on past employment have increased sharply whereas that on expected activity and on general outlook have edged down.
tableauTable 2 – Business climate composite indicator and balances of opinion by sub-sector in services
| Aggregated classification (NA 2008) at level A21 | Mean* | Oct. 17 | Nov. 17 | Dec. 17 | Jan. 18 |
|---|---|---|---|---|---|
| Road transport (8%) | |||||
| Composite indicator | 100 | 113 | 115 | 114 | 111 |
| Past activity | –7 | 7 | 9 | 13 | 12 |
| Expected activity | –8 | 8 | 14 | 11 | 3 |
| Expected demand | –11 | 14 | 15 | 12 | 10 |
| Past employment | –6 | 9 | 15 | 15 | 13 |
| Expected employment | –9 | 14 | 4 | 5 | 7 |
| General outlook | –21 | 3 | 9 | 8 | 10 |
| Accommodation and food service activities (11%) | |||||
| Composite indicator | 100 | 106 | 107 | 112 | 112 |
| Past activity | –7 | –3 | 0 | 13 | 3 |
| Expected activity | –7 | –4 | –1 | 0 | –1 |
| Expected demand | –10 | –4 | –6 | 1 | –1 |
| Past employment | –4 | –5 | 3 | –4 | –2 |
| Expected employment | –6 | –6 | –6 | –2 | –4 |
| General outlook | –14 | –4 | –3 | –1 | 8 |
| Information and communication (24%) | |||||
| Composite indicator | 100 | 104 | 107 | 107 | 105 |
| Past activity | 8 | 20 | 27 | 21 | 20 |
| Expected activity | 9 | 13 | 17 | 21 | 9 |
| Expected demand | 10 | 6 | 10 | 11 | 9 |
| Past employment | 6 | 10 | 12 | 13 | 15 |
| Expected employment | 11 | 16 | 15 | 14 | 15 |
| General outlook | 0 | 3 | 7 | 8 | 3 |
| Real estate activities (13%) | |||||
| Composite indicator | 100 | 99 | 88 | 91 | 85 |
| Past activity | 7 | 9 | 15 | 10 | 13 |
| Expected activity | 7 | 6 | –8 | –8 | –19 |
| Expected demand | 1 | 7 | 0 | 6 | 6 |
| Past employment | 3 | 5 | –3 | 6 | 8 |
| Expected employment | 2 | 7 | 8 | 5 | –3 |
| General outlook | –2 | –12 | –17 | –13 | –14 |
| Professional, scientific and technical activities (24%) | |||||
| Composite indicator | 100 | 109 | 110 | 111 | 111 |
| Past activity | –1 | 1 | 2 | 10 | 8 |
| Expected activity | –2 | 6 | 7 | 6 | 7 |
| Expected demand | –5 | 1 | 5 | 3 | 4 |
| Past employment | 1 | 3 | 7 | 10 | 10 |
| Expected employment | 0 | 12 | 9 | 12 | 10 |
| General outlook | –9 | 2 | 3 | 3 | 5 |
| Administrative and support service activities (18%) | |||||
| Composite indicator | 100 | 109 | 110 | 112 | 113 |
| Past activity | 6 | 9 | 11 | 16 | 21 |
| Expected activity | 5 | 15 | 12 | 14 | 13 |
| Expected demand | 3 | 12 | 16 | 18 | 19 |
| Past employment | 10 | 20 | 25 | 26 | 33 |
| Expected employment | 8 | 6 | 8 | 23 | 26 |
| General outlook | –4 | 11 | 12 | 13 | 12 |
- The figures in parentheses indicate the weights used to aggregate the sub-sector balances of opinion.
- *Composite indicator: average since 1989 (2006 for road transport); balances of opinion: average since 1988 (2006 for road transport)
- Source: INSEE, monthly business survey in services.
Documentation
Abbreviated Methodology (2017) (pdf,177 Ko)
Pour en savoir plus
Time series : Economic outlook surveys – Services