

 3 January 2018
2018- n° 315The rise of prices of second-hand dwellings and of the volume of transactions amplified
in Q3 2017 Notaries-INSEE second-hand dwellings price index - third quarter 2017
3 January 2018
2018- n° 315The rise of prices of second-hand dwellings and of the volume of transactions amplified
in Q3 2017 Notaries-INSEE second-hand dwellings price index - third quarter 2017
3 January 2018: The file of additional data has been updated compared to the publication of 30 November 2017.
In Q3 2017, the rise of prices of second-hand dwellings amplified: +1.6% compared to the previous quarter (provisional seasonally adjusted results), after +0.7%. As observed since the end of 2016, the increase is more important for flats (+1.9%) than for houses (+1.4%).
Over a year, the increase in prices continued to accelerate: +3.9% compared to Q3 2016, after +3.1% the quarter before. This increase was mainly due to prices of flats, which increased by +5.1% over the year, against +3.1% for houses.
In Île-de-France, the rise of prices of second-hand dwellings intensified
In Q3 2017, the prices of second-hand dwellings in Île-de-France continued to rise: +1.6% compared to Q2 2017, after +1.2%.
Year–on–year, the rise in prices reached +4.8%, after +3.9% in Q2 2017 and +3.4% in Q1 2017. This acceleration came from a more accentuate rise in the prices of flats (+5.8% over the year, after +4.7%), especially for the flats in Paris which increased by 7.8% in one year. Yet, the rise in the prices of houses in Île-de-France also amplified (+2.7% after +2.1%).
In provincial France, prices of second-hand dwellings also increased
In Q3 2017, the rise of prices of second-hand dwelling in provincial France was the same as in Île-de-France: +1.6% compared to the previous quarter.
Over one year, the prices increased less markedly than in Île-de-France, though an acceleration in Q3 2017: +3.6% between Q3 2016 and Q3 2017, after +2.7% in the previous quarter. Like in Île-de-France, the rise was more important for flats (+4.5%) than for houses (+3.1%).
graphiqueGraphique1a – Variation in prices of second-hand dwellings in metropolitan France over a year
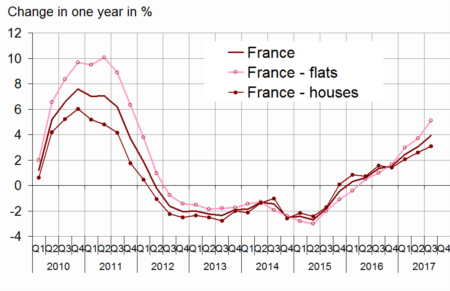
- Sources: INSEE, French notaries - Database Bien, Perval society
graphiqueGraphique2a – Prices of second-hand dwellings in Île-de-France
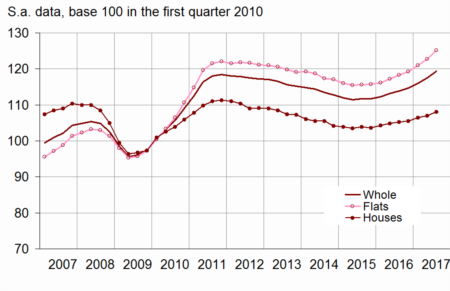
- Scope: Île-de-France
- Sources: INSEE, French notaries - Database Bien, Perval society
tableauTableau1a – Variation in prices of second-hand dwellings in metropolitan France
| change in | ||||||
|---|---|---|---|---|---|---|
| 3 months (S.A.) | 12 months | |||||
| 2017 Q1 | 2017 Q2 (sd) | 2017 Q3 (p) | 2017 Q1 | 2017 Q2 (sd) | 2017 Q3 (p) | |
| France | 1.3 | 0.7 | 1.6 | 2.5 | 3.1 | 3.9 |
| Flats | 1.4 | 1.1 | 1.9 | 3.0 | 3.7 | 5.1 |
| Houses | 1.1 | 0.4 | 1.4 | 2.1 | 2.6 | 3.1 |
- (p): provisional; (sd): semi-definitive
- Scope: Metropolitan France
- Sources: INSEE, French notaries - Database Bien, Perval society
Pursuit of the grow of the annual volume of transactions
In Q3 2017, the annual transaction volume continued to grow: in September, the number of transactions carried out over the last twelve months reached a new historical peak (952,000). This volume of transactions was thus significantly higher than the one recorded one year earlier (825,000 in September 2016). This represented a little less than 3% of the housing stock, which was equivalent to what was observed in 2006.
graphiqueGraphique3a – Volume of transactions of second-hand dwellings over the last 12 months
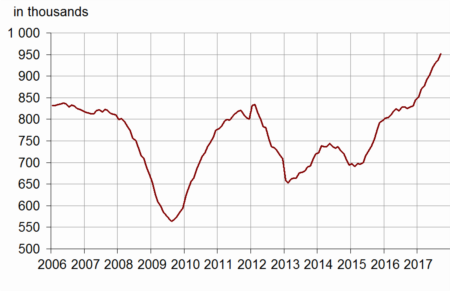
- Scope: France excluding Mayotte
- Sources: CGEDD, based on notarial databases and DGFiP (MEDOC)
Revisions
The second-hand housing price index is revised to include transactions recorded after the previous publication.
In comparison with the results released on 2 October 2017, the change in prices in Q2 2017 has been revised downwards by −0.1 point overall: −0.1 point for houses, −0.2 point for flats. The overall change in prices in Q2 2017 stands at +0.7%, instead of +0.8% (figure published on 2 October) and +1.0% estimated on 7 September.
tableauTableau2a – Variation in prices of second-hand dwellings in metropolitan France
| Change in | ||||||
|---|---|---|---|---|---|---|
| 3 months (S.A.) | 12 months | |||||
| 2017 Q1 | 2017 Q2 (sd) | 2017 Q3 (p) | 2017 Q1 | 2017 Q2 (sd) | 2017 Q3 (p) | |
| Metropolitan France | 1.3 | 0.7 | 1.6 | 2.5 | 3.1 | 3.9 |
| - Flats | 1.4 | 1.1 | 1.9 | 3.0 | 3.7 | 5.1 |
| - Houses | 1.1 | 0.4 | 1.4 | 2.1 | 2.6 | 3.1 |
| Île-de-France | 1.3 | 1.2 | 1.6 | 3.4 | 3.9 | 4.8 |
| Provincial France | 1.2 | 0.4 | 1.6 | 2.0 | 2.7 | 3.6 |
| Flats | ||||||
| Île-de-France | 1.5 | 1.5 | 1.9 | 4.1 | 4.7 | 5.8 |
| - Paris | 1.6 | 2.6 | 2.0 | 5.5 | 6.8 | 7.8 |
| - Seine-et-Marne | 1.7 | -0.9 | -0.1 | 3.2 | 2.3 | 1.3 |
| - Yvelines | 0.4 | 0.5 | 1.3 | 2.1 | 2.0 | 2.9 |
| - Essonne | 1.4 | -0.7 | 0.5 | 2.0 | 1.2 | 1.2 |
| - Hauts-de-Seine | 1.5 | 1.4 | 2.3 | 3.3 | 3.9 | 5.6 |
| - Seine-Saint-Denis | 2.1 | 0.4 | 2.7 | 2.7 | 2.6 | 4.8 |
| - Val-de-Marne | 1.6 | 0.6 | 2.2 | 3.3 | 3.1 | 4.8 |
| - Val-d'Oise | 0.9 | -0.7 | 0.6 | 2.4 | 1.4 | 1.4 |
| Provincial France | 1.3 | 0.7 | 1.8 | 1.9 | 2.8 | 4.5 |
| - Conurbation > 10 000 inhabitants | 1.2 | 0.8 | ** | 1.8 | 2.9 | ** |
| - Central town | 1.4 | 1.0 | ** | 2.2 | 3.3 | ** |
| - Suburb | 0.9 | 0.5 | ** | 1.2 | 2.2 | ** |
| - Conurbation < 10 000 inhabitants | 2.3 | -0.5 | ** | 3.0 | 1.9 | ** |
| Houses | ||||||
| Île-de-France | 0.8 | 0.6 | 1.0 | 2.0 | 2.1 | 2.7 |
| - Seine-et-Marne | 1.0 | 0.2 | 1.2 | 2.1 | 2.0 | 2.7 |
| - Yvelines | 0.8 | 0.6 | 0.5 | 1.9 | 2.3 | 2.2 |
| - Essonne | 1.0 | 0.6 | 0.6 | 2.3 | 2.1 | 2.5 |
| - Hauts-de-Seine | -0.1 | 1.3 | 1.4 | 0.7 | 2.2 | 3.7 |
| - Seine-Saint-Denis | 1.2 | 0.7 | 1.7 | 2.8 | 2.3 | 3.8 |
| - Val-de-Marne | 0.9 | 0.9 | 1.0 | 2.0 | 2.1 | 3.0 |
| - Val-d'Oise | 1.2 | 0.1 | 0.9 | 2.4 | 1.9 | 2.1 |
| Provincial France | 1.2 | 0.3 | 1.5 | 2.1 | 2.7 | 3.1 |
| Nord-Pas de Calais | 0.8 | 0.3 | ** | 2.1 | 2.4 | ** |
| - Flats | 0.2 | 0.6 | ** | 2.1 | 3.0 | ** |
| - Houses | 0.9 | 0.3 | ** | 2.1 | 2.3 | ** |
| - Lille Houses | 0.2 | 0.1 | ** | 2.3 | 1.5 | ** |
| Provence-Alpes-Côte d'Azur | 0.6 | 0.0 | ** | 0.8 | 2.5 | ** |
| - Flats | 0.3 | 0.0 | ** | 1.3 | 1.5 | ** |
| - Houses | 0.9 | 0.0 | ** | 0.3 | 3.5 | ** |
| - Marseille Flats | 5.0 | -1.8 | ** | 5.2 | 2.1 | ** |
| Rhône-Alpes | 1.0 | 0.4 | ** | 2.2 | 2.3 | ** |
| - Flats | 1.8 | 1.0 | ** | 2.2 | 3.2 | ** |
| - Houses | 0.3 | -0.2 | ** | 2.3 | 1.5 | ** |
| - Lyon Flats | 1.4 | 3.5 | ** | 3.9 | 6.7 | ** |
- ** index released on 3 January 2018.
- (p): provisional ; (sd): semi-definitive
- Sources: INSEE, French notaries - Database Bien, Perval society