

 23 November 2017
2017- n° 306In November 2017, the business climate in services is at the highest since May 2011 Monthly survey of services - November 2017
23 November 2017
2017- n° 306In November 2017, the business climate in services is at the highest since May 2011 Monthly survey of services - November 2017
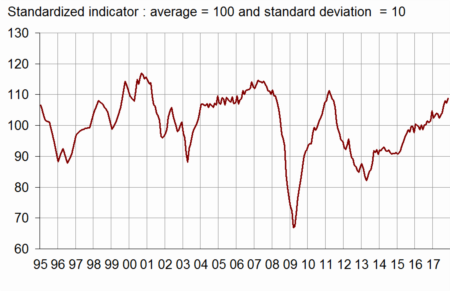
According to business managers surveyed in November 2017, the business climate in services has improved anew. The business climate composite indicator has gained two points and reached 109, its highest level since May 2011.
- Buoyant prospects of activity and demand
- In road transport, the business climate has reached a level unseen since July 2007
- In accommodation and food services, the business climate has improved
- The business climate stands at its highest level since July 2011 in information and communication
- In real estate activities, the business climate has plummeted further
- In professional, scientific and technical activities, the business climate is at its highest since January 2008
- The business climate has improved in administrative and support service activities
According to business managers surveyed in November 2017, the business climate in services has improved anew. The business climate composite indicator has gained two points and reached 109, its highest level since May 2011.
graphiqueGraph 1 – Business climate composite indicator
The turning point indicator remains in the area indicating a favourable short-term economic situation.
graphiqueGraph 2 – Turning point indicator
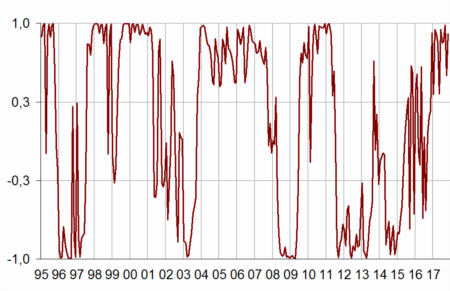
- Note: close to 1 (respectively –1), this indicator indicates a favourable short-term economic situation (respectively unfavourable). The uncertainty area is between –0.3 and +0.3.
Buoyant prospects of activity and demand
The balances of opinion on general outlook, on expected demand and past activity have increased in November. The one on expected activity remains stable. All are well above their long-term average.
The balance on past employment has sharply increased in November, exceeding even more its long-term average. In contrast, the balance on expected employment has declined due to services, except temporary work agencies. However, it remains above its average.
tableauTable 1 – Economic outlook in the services sector
| Average* | Aug. 17 | Sept. 17 | Oct. 17 | Nov. 17 | |
|---|---|---|---|---|---|
| Composite indicator | 100 | 107 | 108 | 107 | 109 |
| General outlook | –8 | 3 | 3 | 2 | 3 |
| Past activity | 2 | 7 | 9 | 9 | 11 |
| Expected activity | 2 | 7 | 8 | 8 | 8 |
| Expected demand | –1 | 5 | 6 | 5 | 8 |
| Past selling prices | –4 | –9 | –4 | –5 | –1 |
| Expected selling prices | –3 | –6 | –1 | –3 | –3 |
| Past employment | 3 | 7 | 8 | 10 | 13 |
| except temporary work agencies | 1 | 3 | 2 | 4 | 6 |
| Expected employment | 2 | 6 | 8 | 7 | 6 |
| except temporary work agencies | –1 | 1 | 4 | 5 | 3 |
| Investments | |||||
| Past investments | 2 | 5 | 4 | 6 | 6 |
| Expected investments | 1 | 6 | 6 | 4 | 7 |
- * Average since 1989 for the composite indicator and since 1988 for the balances of opinion
- Source: INSEE, monthly business survey in services.
The business climate indicator has improved and stands well above its long-term average in almost all the service sub-sectors. The only exception is the sector of real estate activities, where the climate has continued to deteriorate.
In road transport, the business climate has reached a level unseen since July 2007
In road transport, despite the decrease in the balances on expected employment and past activity, the business climate has gained three points because of the strong increase in the balances on expected activity, past employment and general outlook. At 116, it stands at its highest level since July 2007.
In accommodation and food services, the business climate has improved
In accommodation and food services, the business climate has gained two points (108) mainly due to the rise in the balances on past employment and on expected activity. However, the balances on past activity and expected employment have declined.
The business climate stands at its highest level since July 2011 in information and communication
In information and communication, the business climate has gone up anew (+3 points). At 107, it has reached a level unseen since July 2011. The different balances have grown except the one on expected employment which is steady. All of them are above their long-term average.
In real estate activities, the business climate has plummeted further
The business climate has continued to worsen in real estate activities and has returned to its lowest level since June 2013. It has lost eleven points because of the fall in balances on expected activity, on expected demand, on past employment and on general outlook, mainly in the sector of housing rental.
In professional, scientific and technical activities, the business climate is at its highest since January 2008
The business climate in professional, scientific and technical activities has gained two points and reached its highest level since January 2008. The balances on expected activity and demand, past employment, and general outlook have gone up. In contrast, the one on expected employment has fallen back. All the balances are above their average.
The business climate has improved in administrative and support service activities
In administrative and support service activities, the business climate indicator has increased for the fourth month in a row. At 110, it stands at its highest level since May 2011. All balances have climbed except the one on expected activity, in sharp decline. The balances are all above their average.
tableauTable 2 – Business climate composite indicator and balances of opinion by sub-sector in services
| Aggregated classification (NA 2008) at level A21 | Mean* | Aug. 17 | Sept. 17 | Oct. 17 | Nov. 17 |
|---|---|---|---|---|---|
| Road transport (8%) | |||||
| Composite indicator | 100 | 109 | 110 | 113 | 116 |
| Past activity | –7 | 7 | 7 | 7 | 4 |
| Expected activity | –8 | 2 | 6 | 8 | 16 |
| Expected demand | –11 | 6 | 4 | 14 | 16 |
| Past employment | –6 | 9 | 5 | 9 | 17 |
| Expected employment | –9 | 3 | 6 | 14 | 6 |
| General outlook | –22 | 5 | 1 | 3 | 9 |
| Accommodation and food service activities (11%) | |||||
| Composite indicator | 100 | 107 | 110 | 106 | 108 |
| Past activity | –7 | –1 | 1 | –3 | –4 |
| Expected activity | –7 | 2 | –1 | –4 | –1 |
| Expected demand | –10 | –6 | 4 | –4 | –2 |
| Past employment | –4 | 0 | –5 | –5 | 3 |
| Expected employment | –6 | –8 | –9 | –6 | –8 |
| General outlook | –14 | –5 | –2 | –4 | –3 |
| Information and communication (24%) | |||||
| Composite indicator | 100 | 105 | 105 | 104 | 107 |
| Past activity | 8 | 12 | 18 | 20 | 26 |
| Expected activity | 9 | 16 | 15 | 13 | 18 |
| Expected demand | 10 | 17 | 8 | 6 | 11 |
| Past employment | 6 | 15 | 5 | 10 | 11 |
| Expected employment | 11 | 17 | 20 | 16 | 16 |
| General outlook | 0 | 4 | 3 | 3 | 7 |
| Real estate activities (13%) | |||||
| Composite indicator | 100 | 103 | 105 | 99 | 88 |
| Past activity | 7 | 9 | 11 | 9 | 15 |
| Expected activity | 8 | 9 | 13 | 6 | –8 |
| Expected demand | 1 | 6 | 4 | 7 | 1 |
| Past employment | 3 | 4 | –3 | 5 | –3 |
| Expected employment | 3 | 1 | 6 | 7 | 9 |
| General outlook | –2 | 2 | 5 | –12 | –17 |
| Professional, scientific and technical activities (24%) | |||||
| Composite indicator | 100 | 106 | 108 | 109 | 111 |
| Past activity | –1 | 4 | 5 | 1 | 1 |
| Expected activity | –2 | 6 | 3 | 6 | 7 |
| Expected demand | –5 | 0 | 3 | 1 | 5 |
| Past employment | 1 | –1 | 2 | 3 | 6 |
| Expected employment | 0 | 9 | 11 | 12 | 10 |
| General outlook | –9 | –3 | 0 | 2 | 4 |
| Administrative and support service activities (18%) | |||||
| Composite indicator | 100 | 104 | 107 | 109 | 110 |
| Past activity | 6 | 12 | 11 | 9 | 12 |
| Expected activity | 5 | 4 | 8 | 15 | 11 |
| Expected demand | 3 | 4 | 10 | 12 | 16 |
| Past employment | 10 | 13 | 19 | 20 | 27 |
| Expected employment | 8 | 9 | 14 | 6 | 8 |
| General outlook | –4 | 10 | 9 | 11 | 13 |
- The figures in parentheses indicate the weights used to aggregate the sub-sector balances of opinion.
- *Composite indicator: average since 1989 (2006 for road transport); balances of opinion : average since 1988 (2006 for road transport)
- Source: INSEE, monthly business survey in services.
Documentation
Abbreviated Methodology (2017) (pdf,177 Ko)
Pour en savoir plus
Time series : Economic outlook surveys – Services